How do I access device information for analytics and reporting?
Accessing device-level information helps you understand how users interact with your Community Media Network across platforms and environments. This enables you to:
- Analyze audience distribution by device, OS, and platform
- Optimize content and experiences for high-performing devices
- Improve app/web performance and engagement
- Enhance monetization strategies through better targeting and reporting
Device insights are critical for making data-driven decisions across product, content, and revenue teams.
Guide: Step-by-step process to access device information
Step 1: Navigate to analytics
- Log in to your Brand Control Center
- Go to Monetize > Reports or Analytics Dashboard (based on your setup)
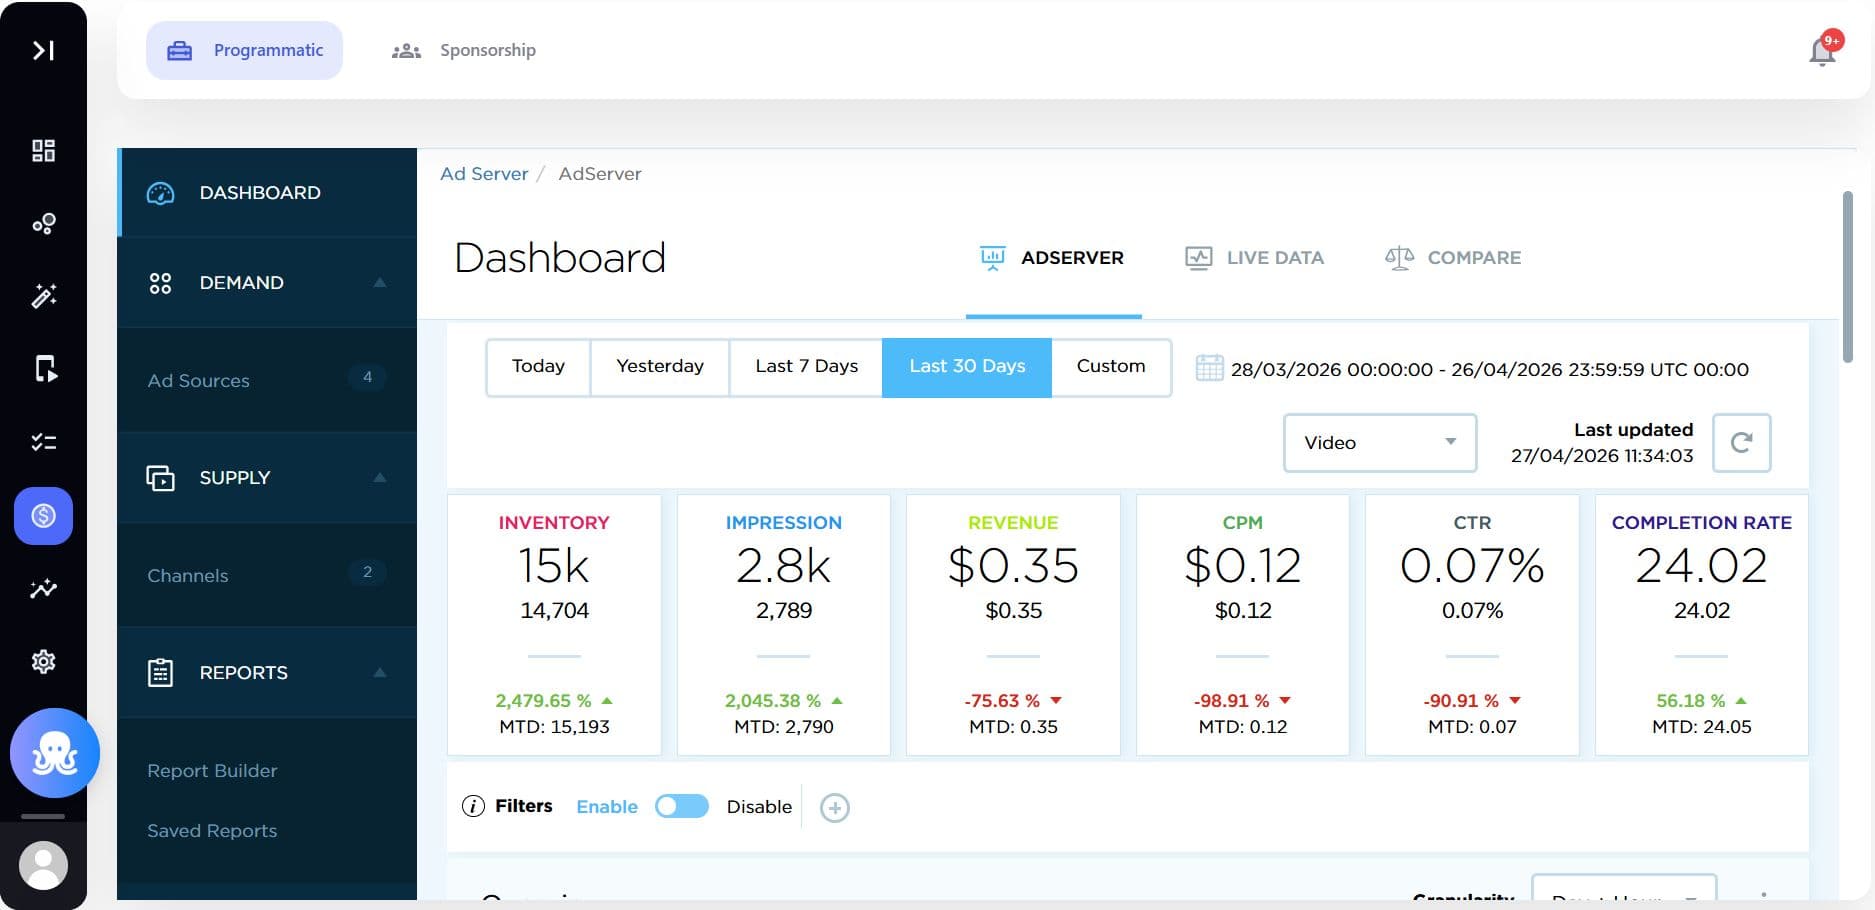
Step 2: Select report type
- Choose the relevant report:
- Adserver Reports (for monetization insights)
- Live Data
- Compare
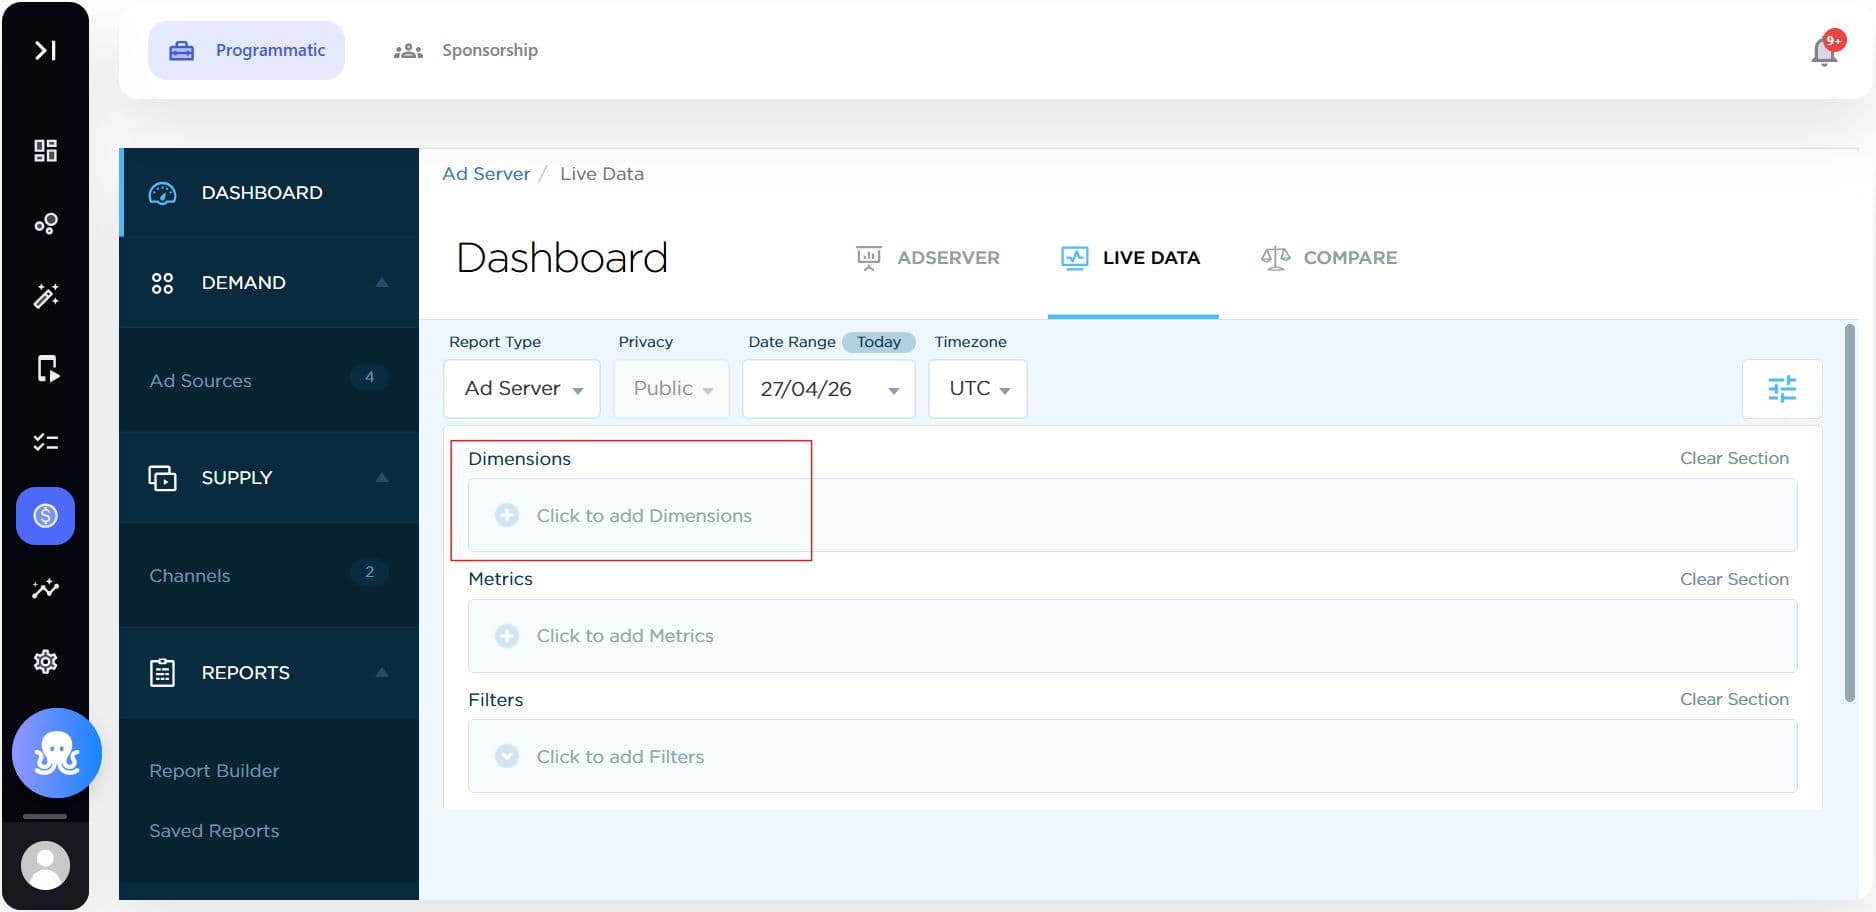
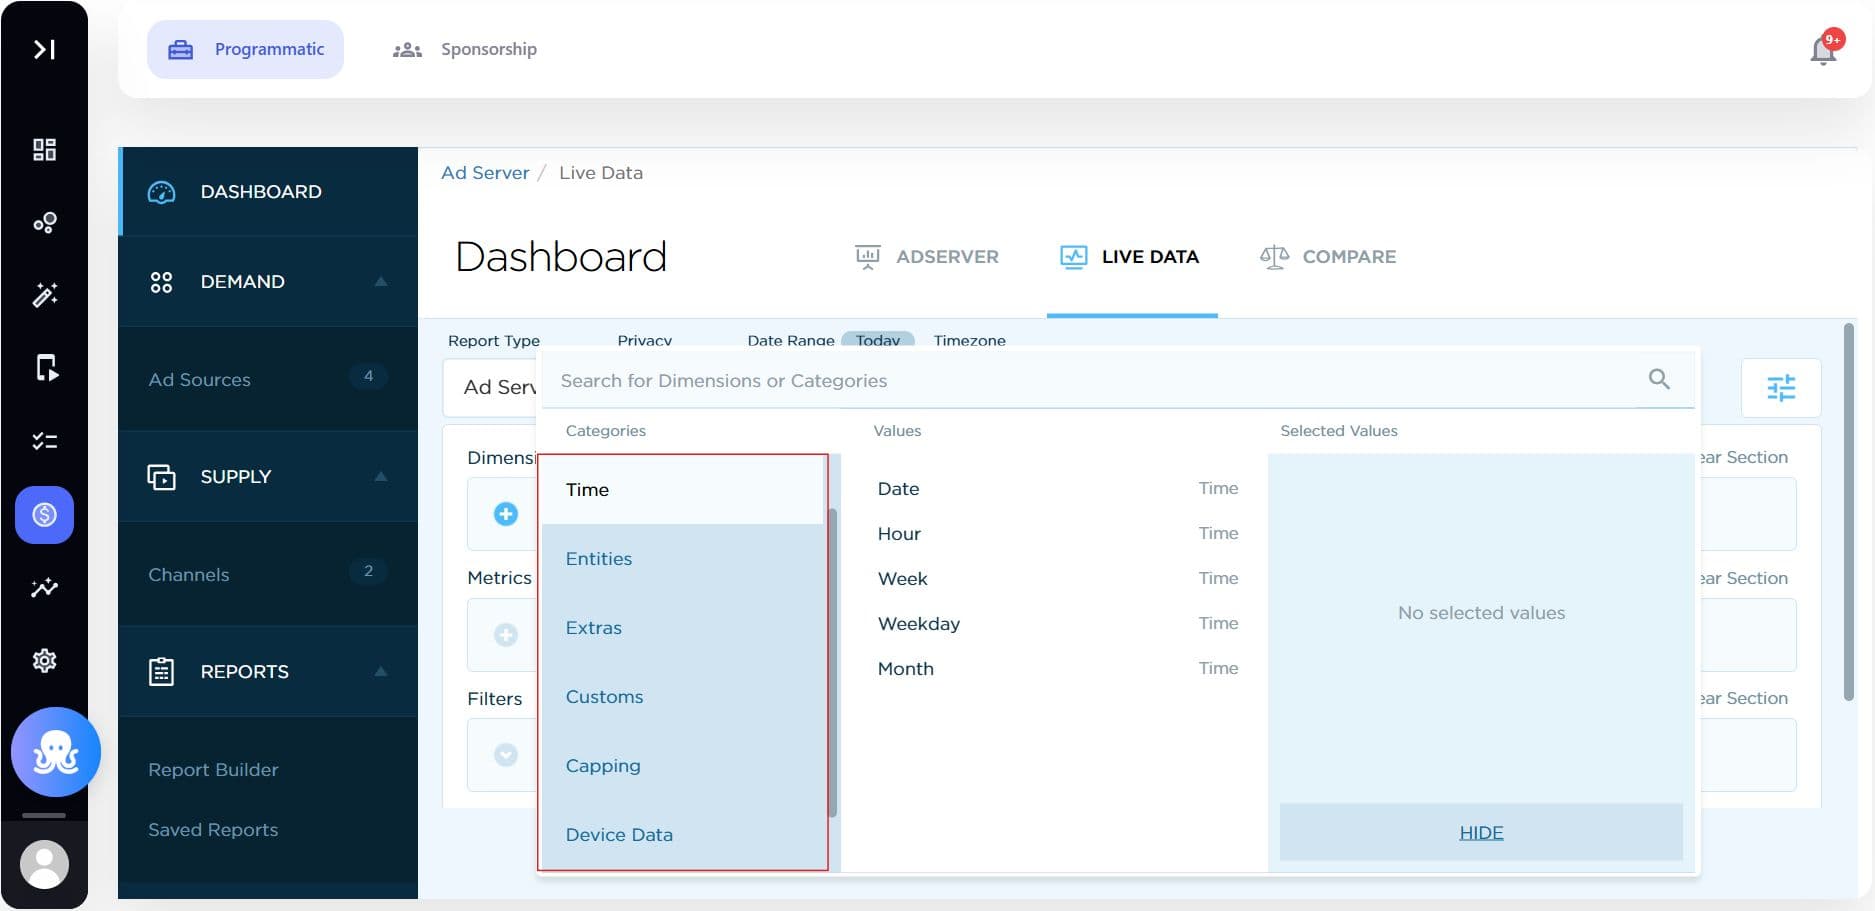
Step 3: Apply dimensions for device data
- In the report configuration panel, select Dimensions such as:
- Time (Date/Hour/Week/Weekday/Month)
- Entities (Ad Source - ID/Name/Creation Time/Status, Channel - ID/Name/Creation Date/Status/Environment/Start Floor/AB Test/etc..)
- Extras (Advertiser Domain/App Name/Country/Country Name/OS/Domain/Grouped Domain/Sub ID/Browser Name/Ad Type/City/etc..)
- Customs
- Capping (Impression/Completion/Revenue/Request/Frequency)
- Device Data (App Name/Model/Type/Name/Brand)
- SDK (Version Name/Installation ID/Duration/JS Player Bridge Version/Timezone Offset/Placement Type/Battery Saving/Latitude/Longitude/Session ID)
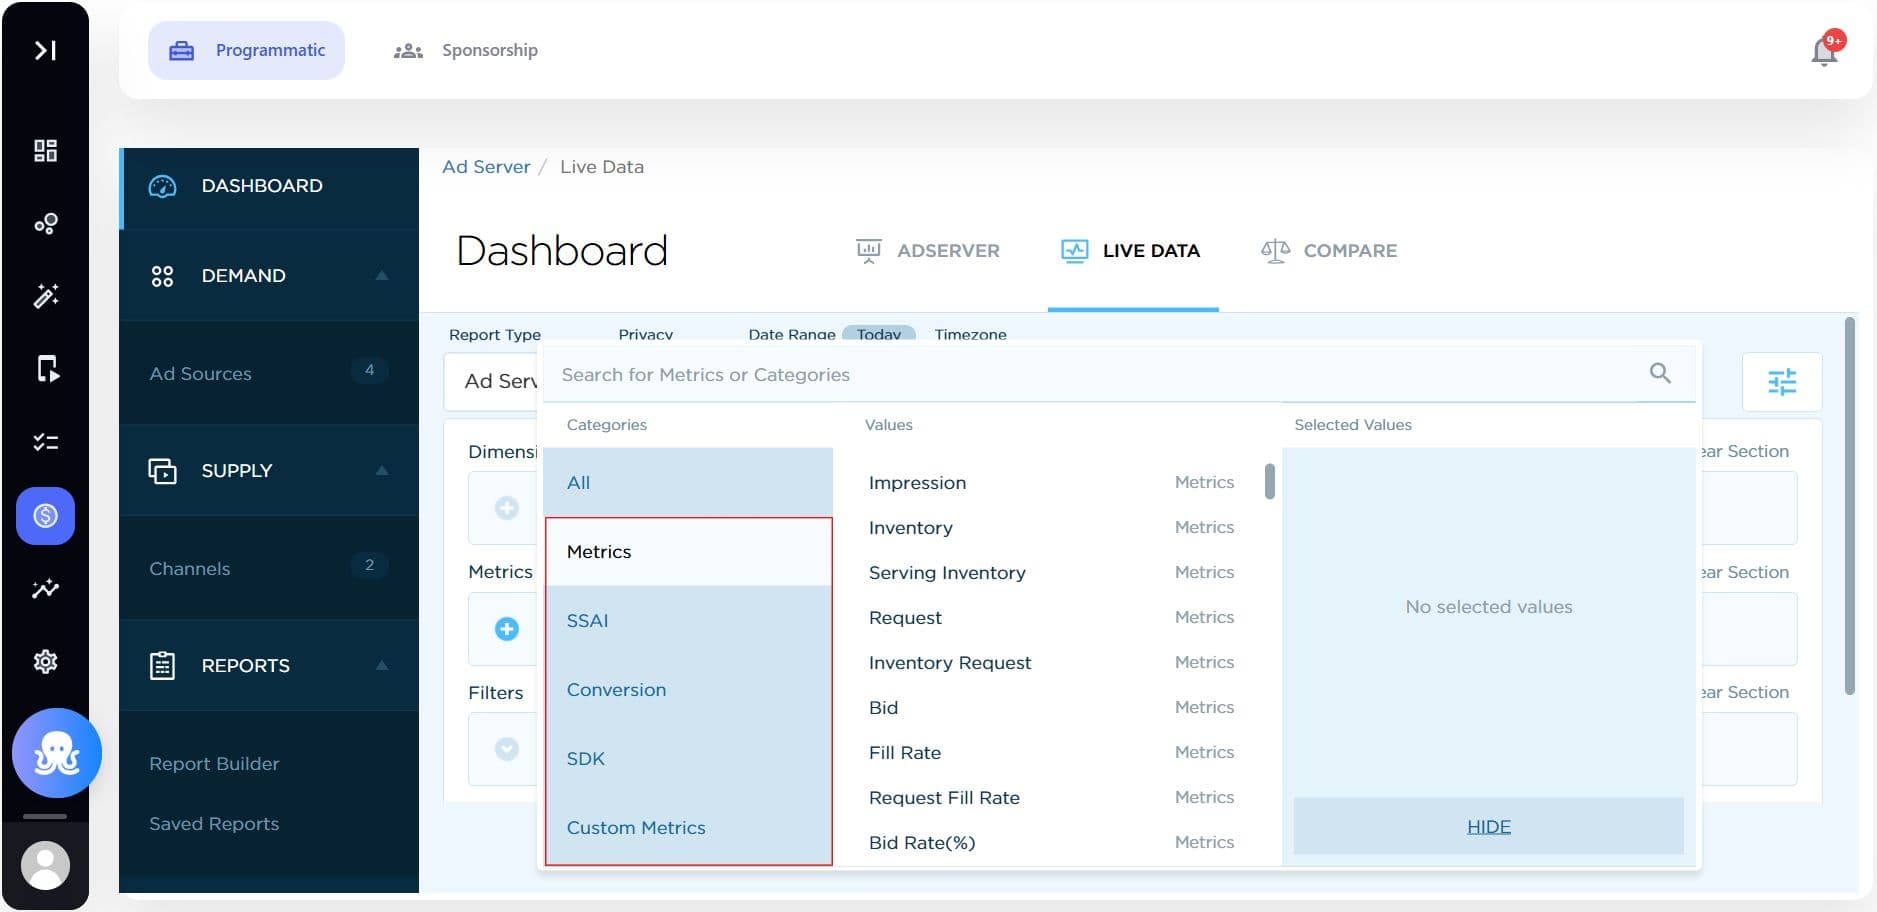
Step 4: Choose metrics
- Select relevant Metrics based on your goal:

- Metrics (Impression/Inventory/Request/Bid/Fill Rate/Average Viewability/Companion Click/Start/Mute/Unmute/Pause/Resume/etc..)
- SSAI (Pod Time - Filled/Returned/Watched, Render Rate, Pod Create, Slots, Stitched, Filler - Start/Impression/Midpoint/Complete, Content Started/etc..)
- Conversion (Impression/PreBid Win/Click/Lead/Install/Action/Complete View/Supply)
- SDK (Placement - Created/Attached/Detached/Displayed, Player - Created/Attached to Placement, Tag Download - Requested/Success/Failure, Player Released, MPV, MPV2)
- Custom Metrics
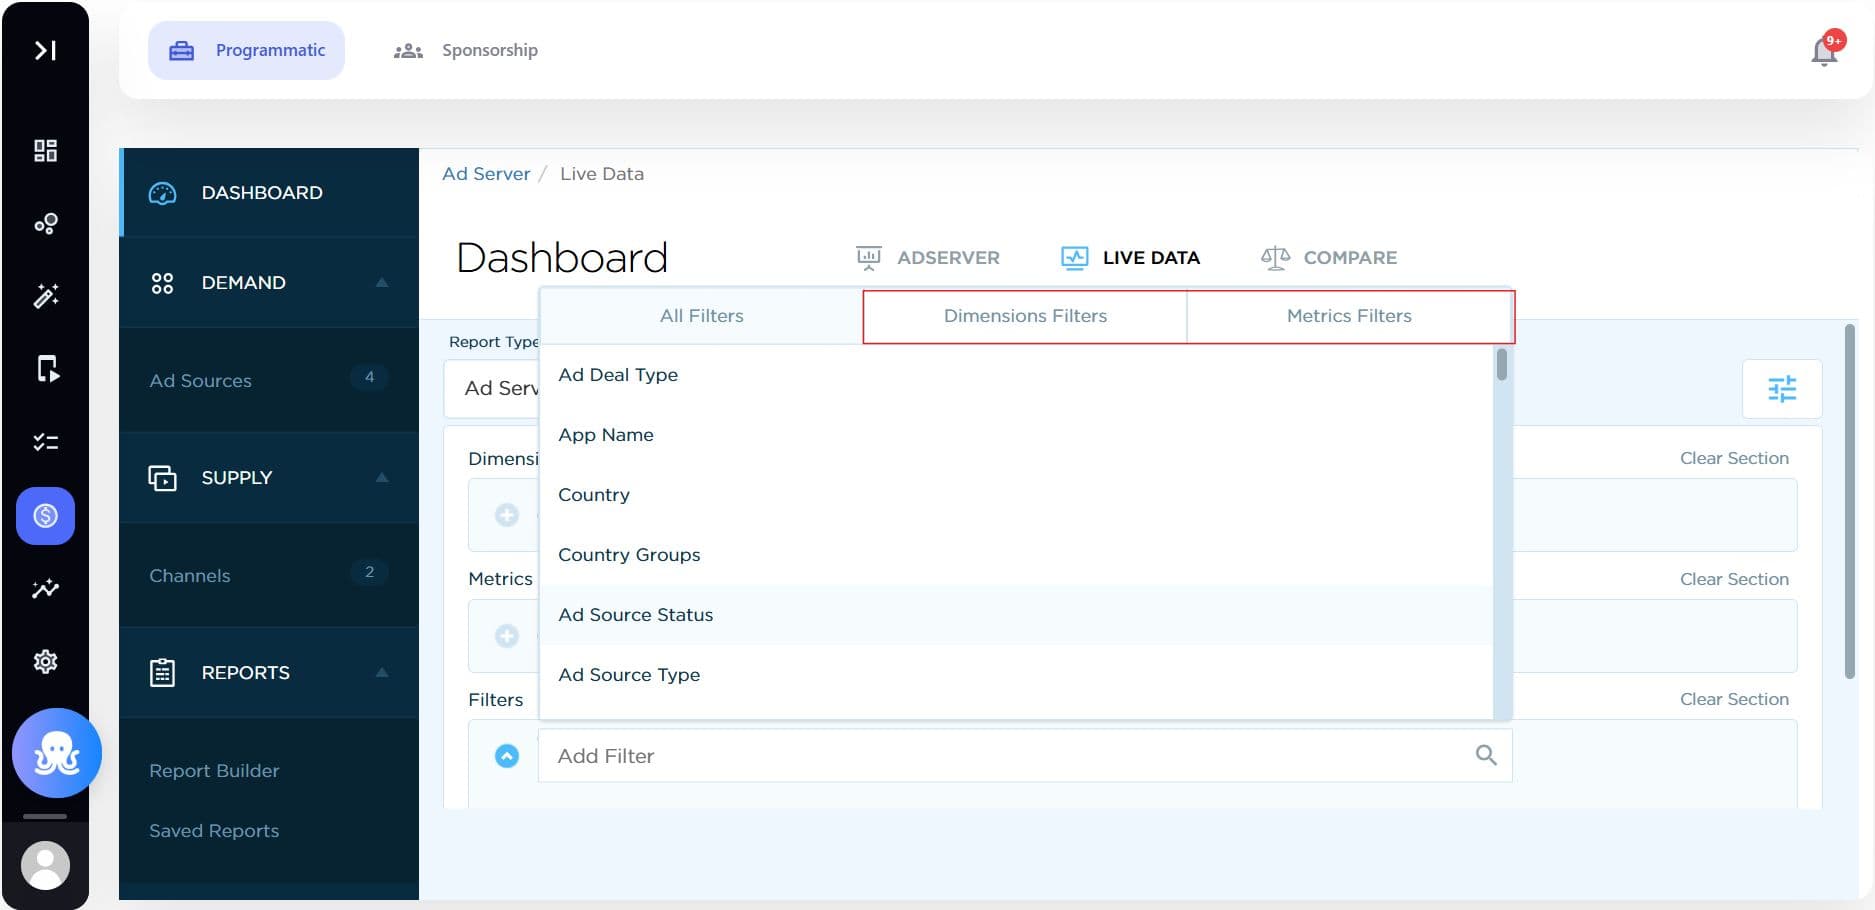
Step 5: Apply filters and date range
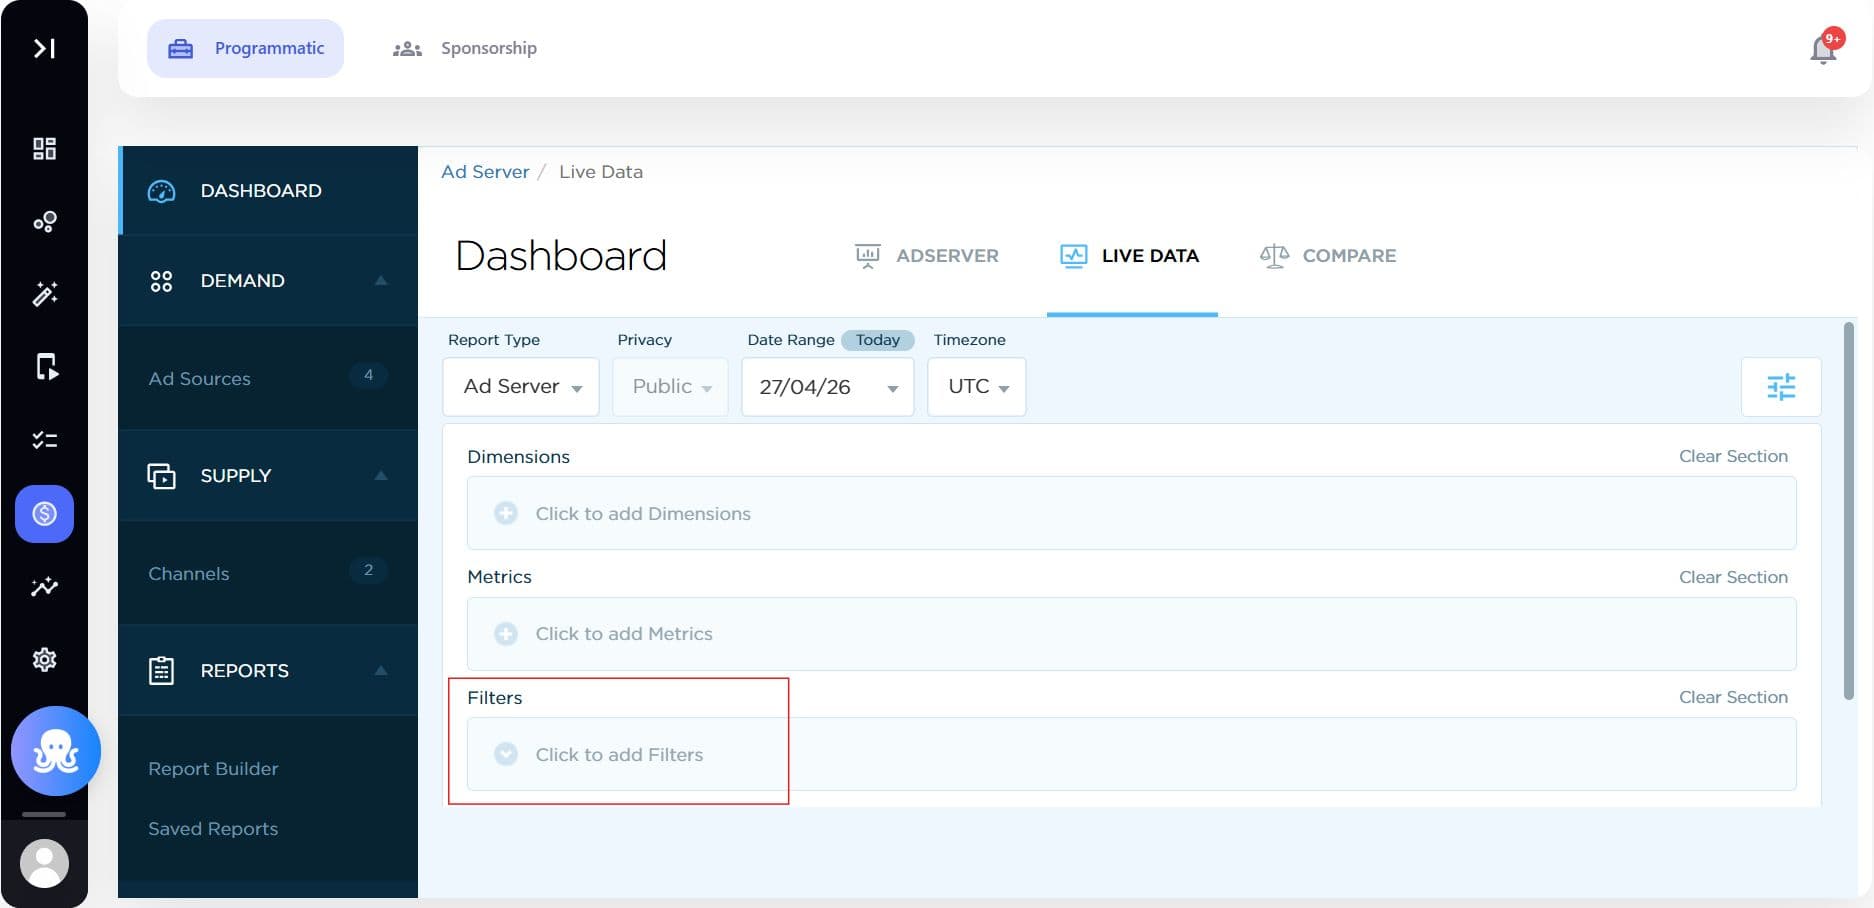
Utilize either Metric or Dimension Filters to refine your data.
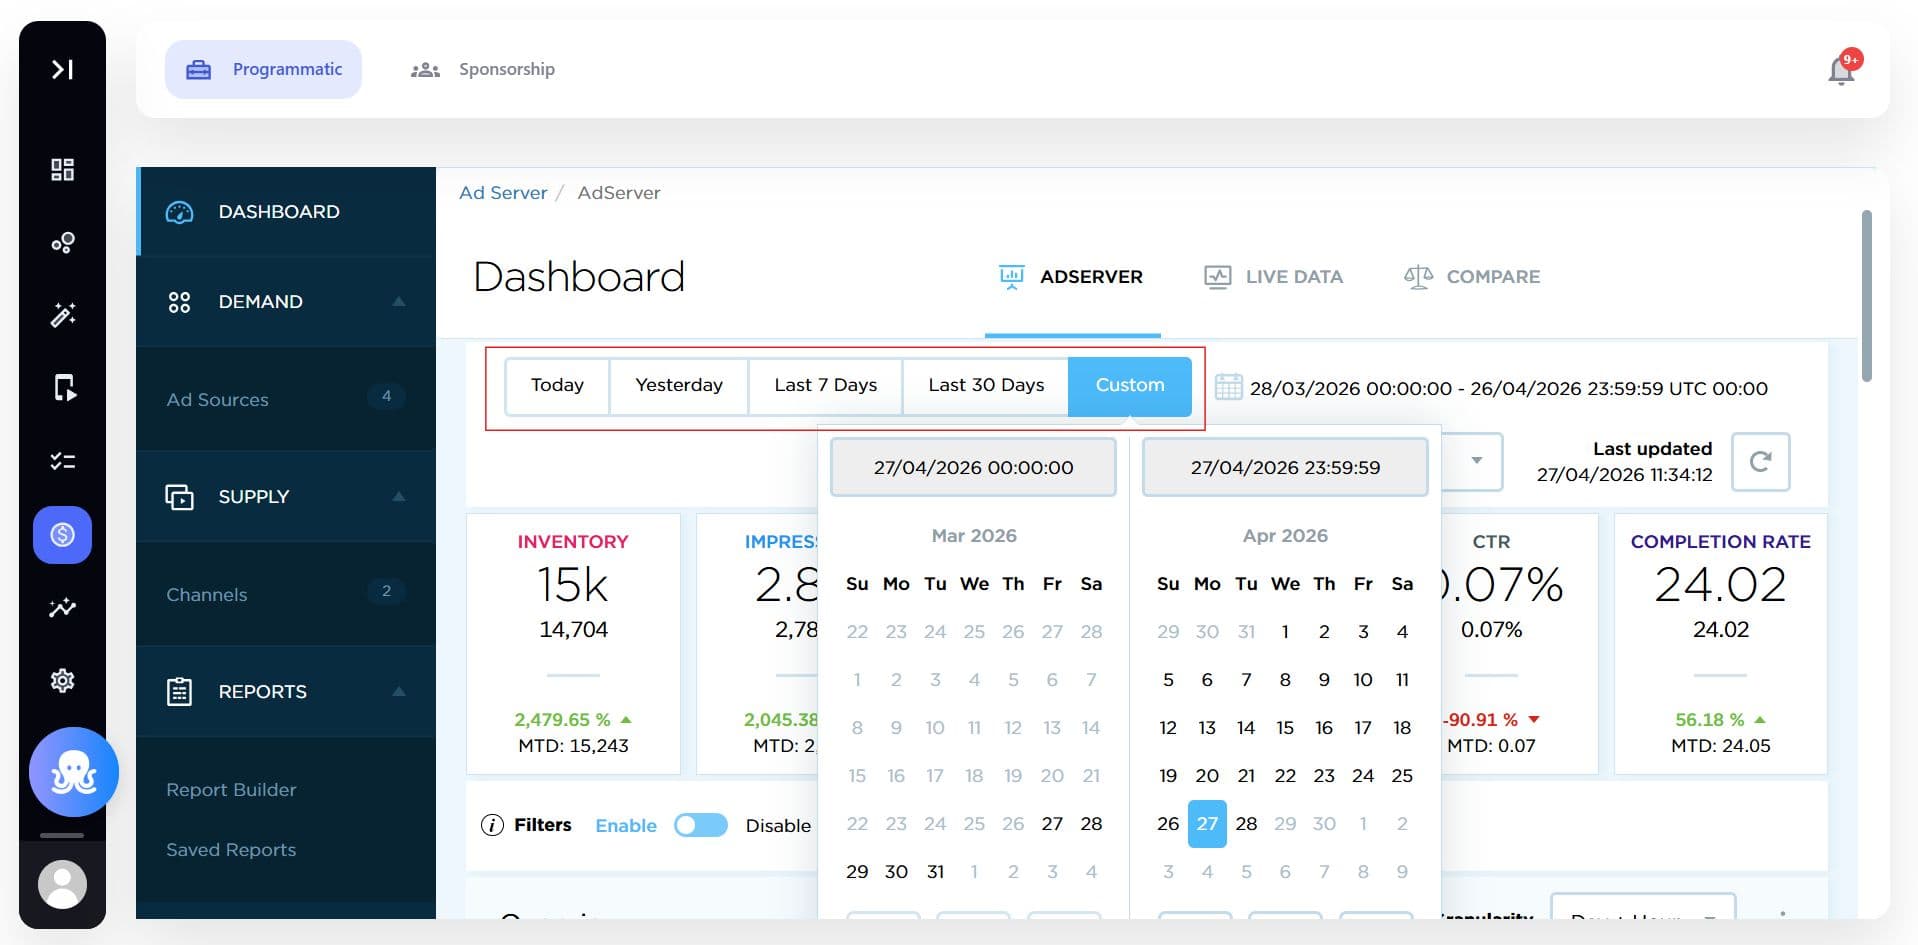
- Define the Date Range:
- Select from preset options like Today, Yesterday, the Last 7 or 30 Days, or input a Custom range.
- Implement specific filters, including:
- Format of content (such as Display or Video)
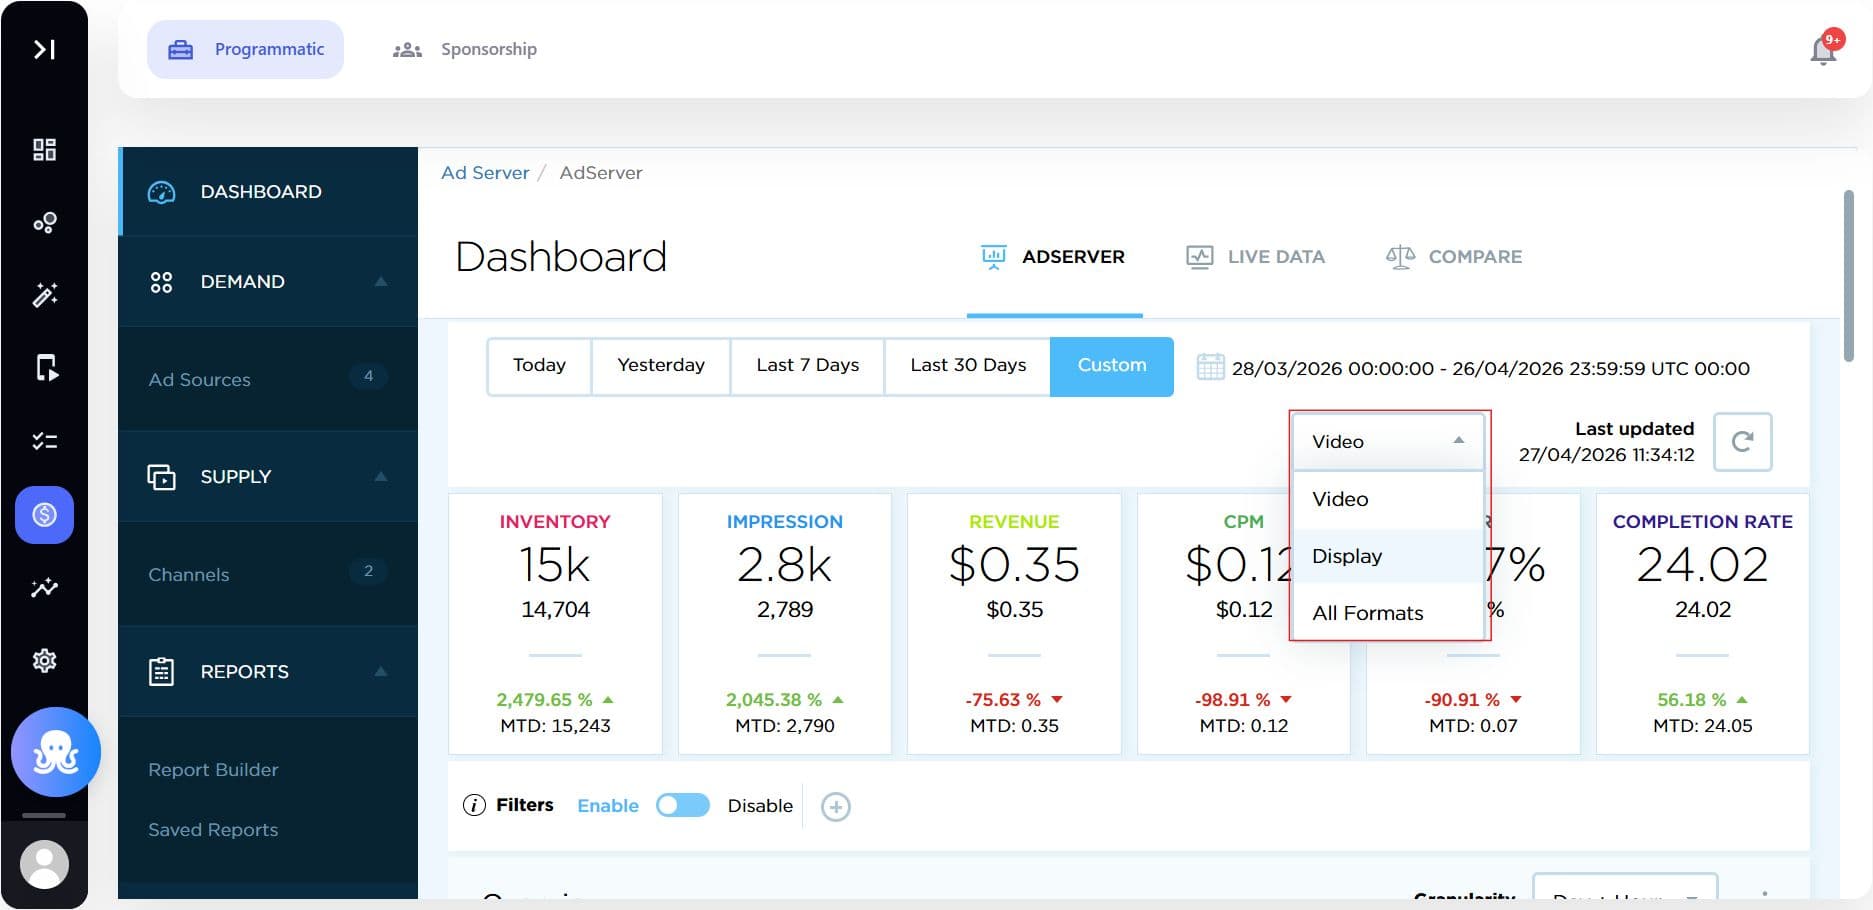
- Revenue & Performance
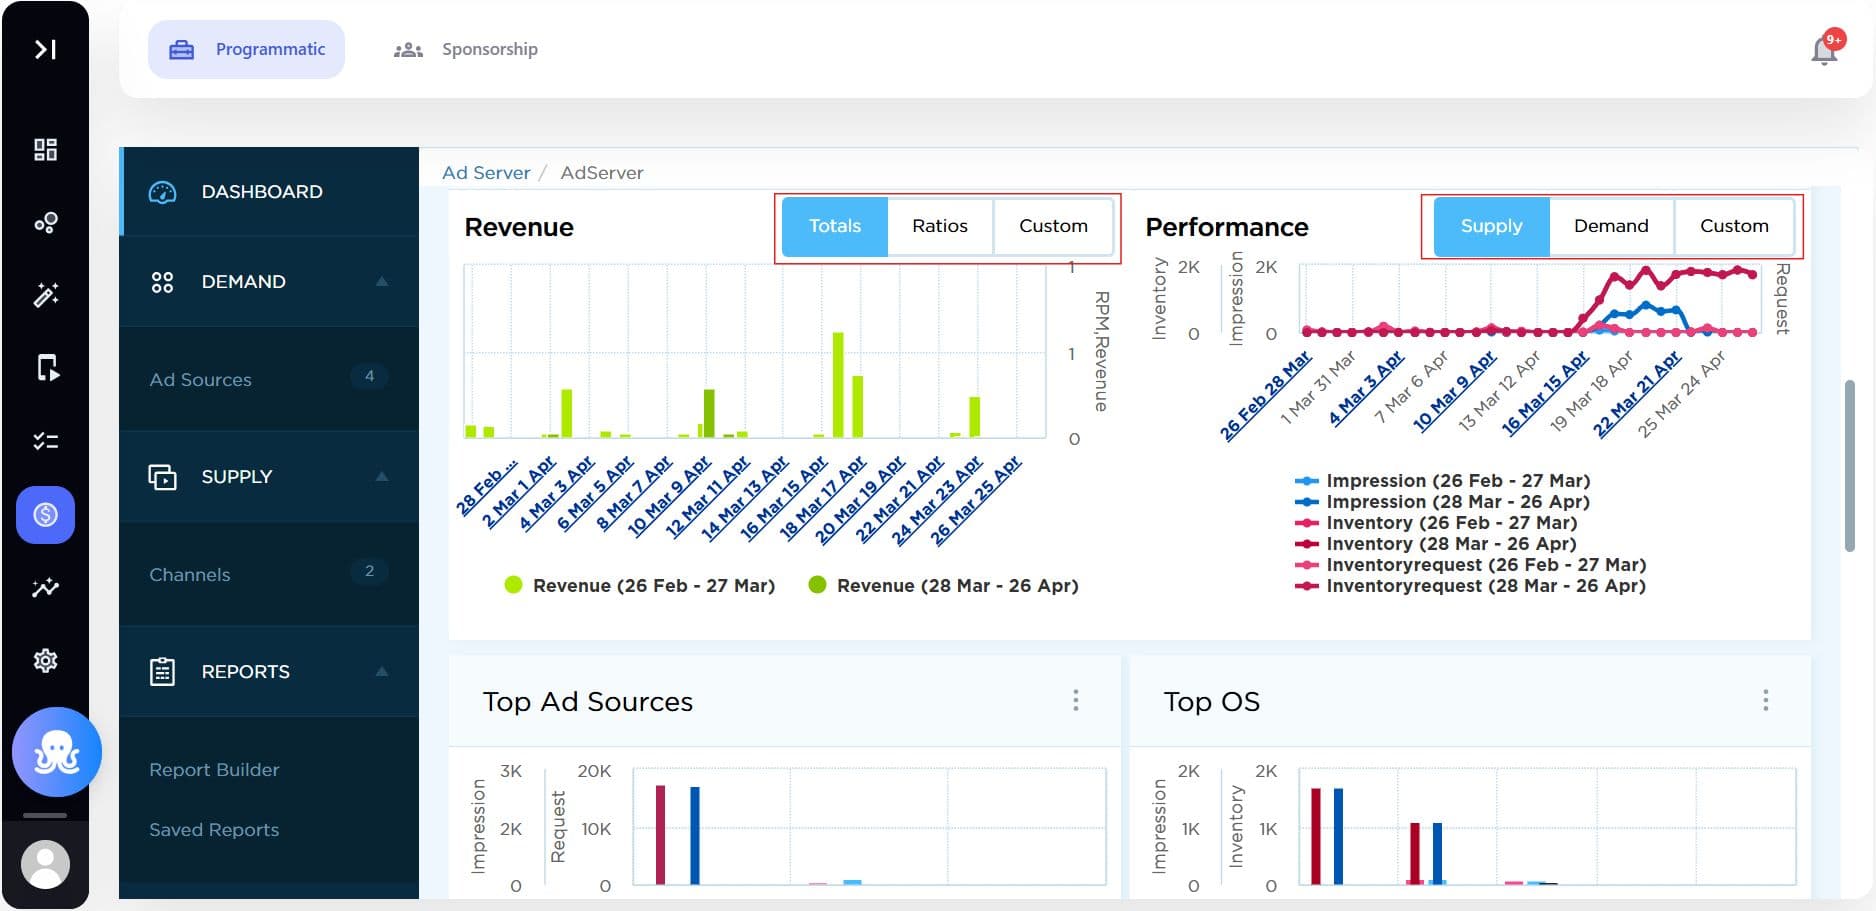
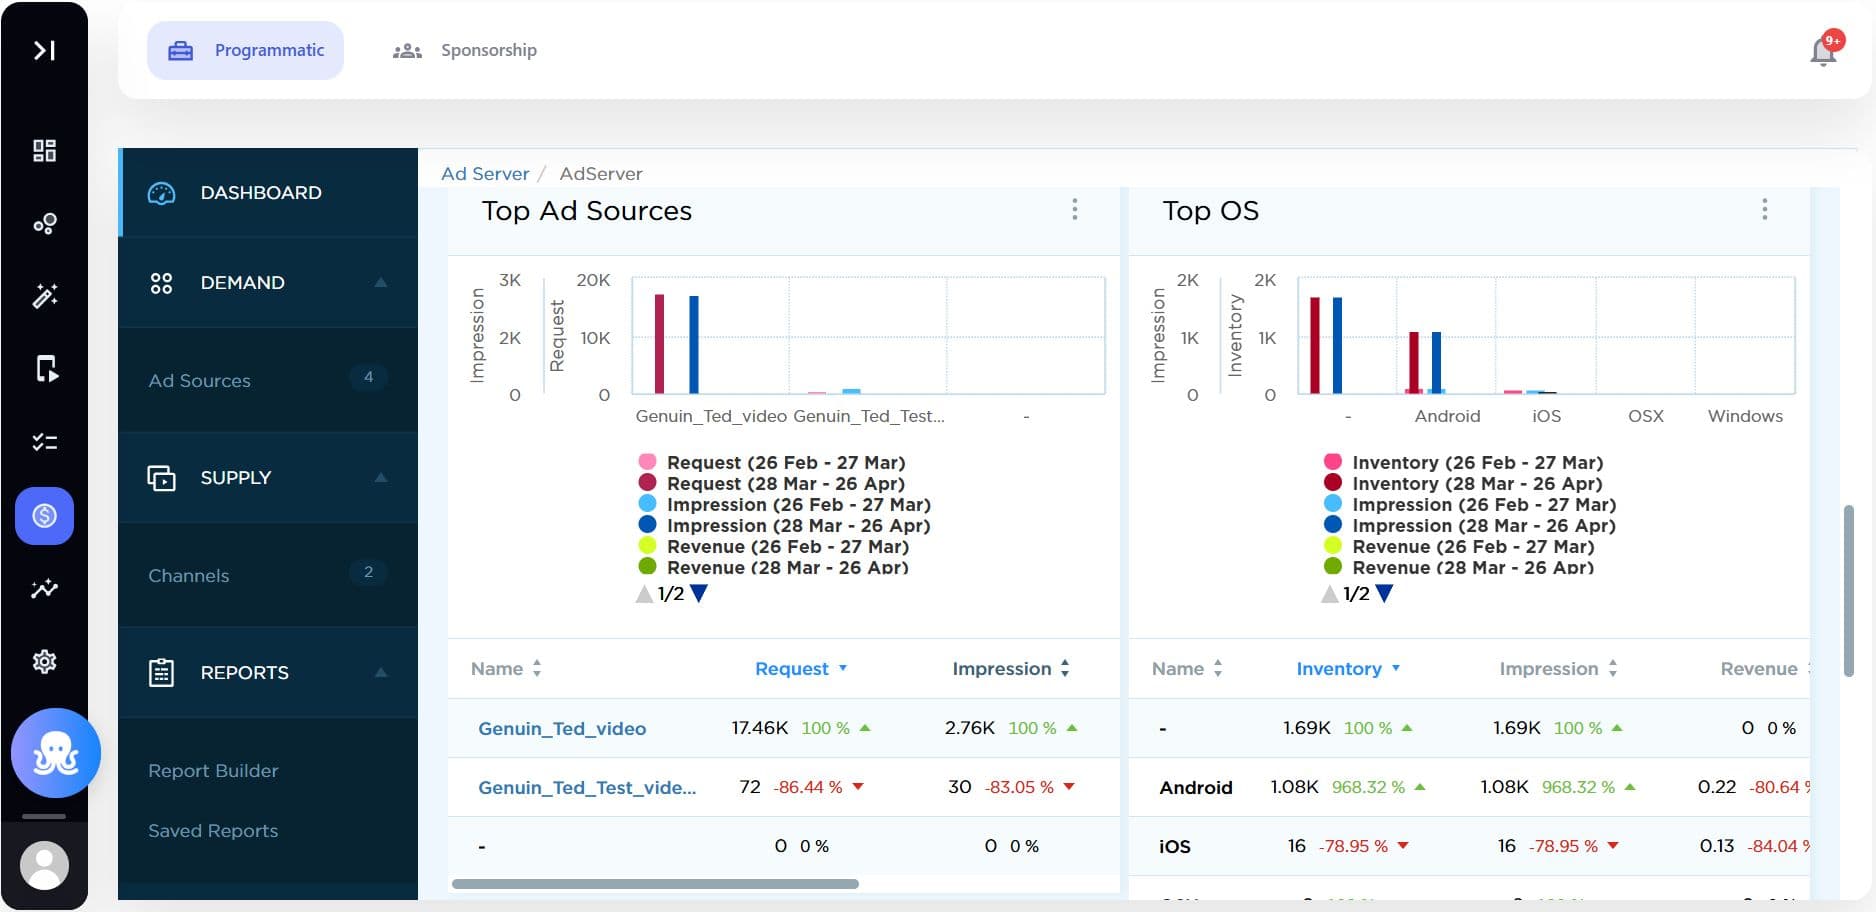
- Top Ad Sources and Top OS
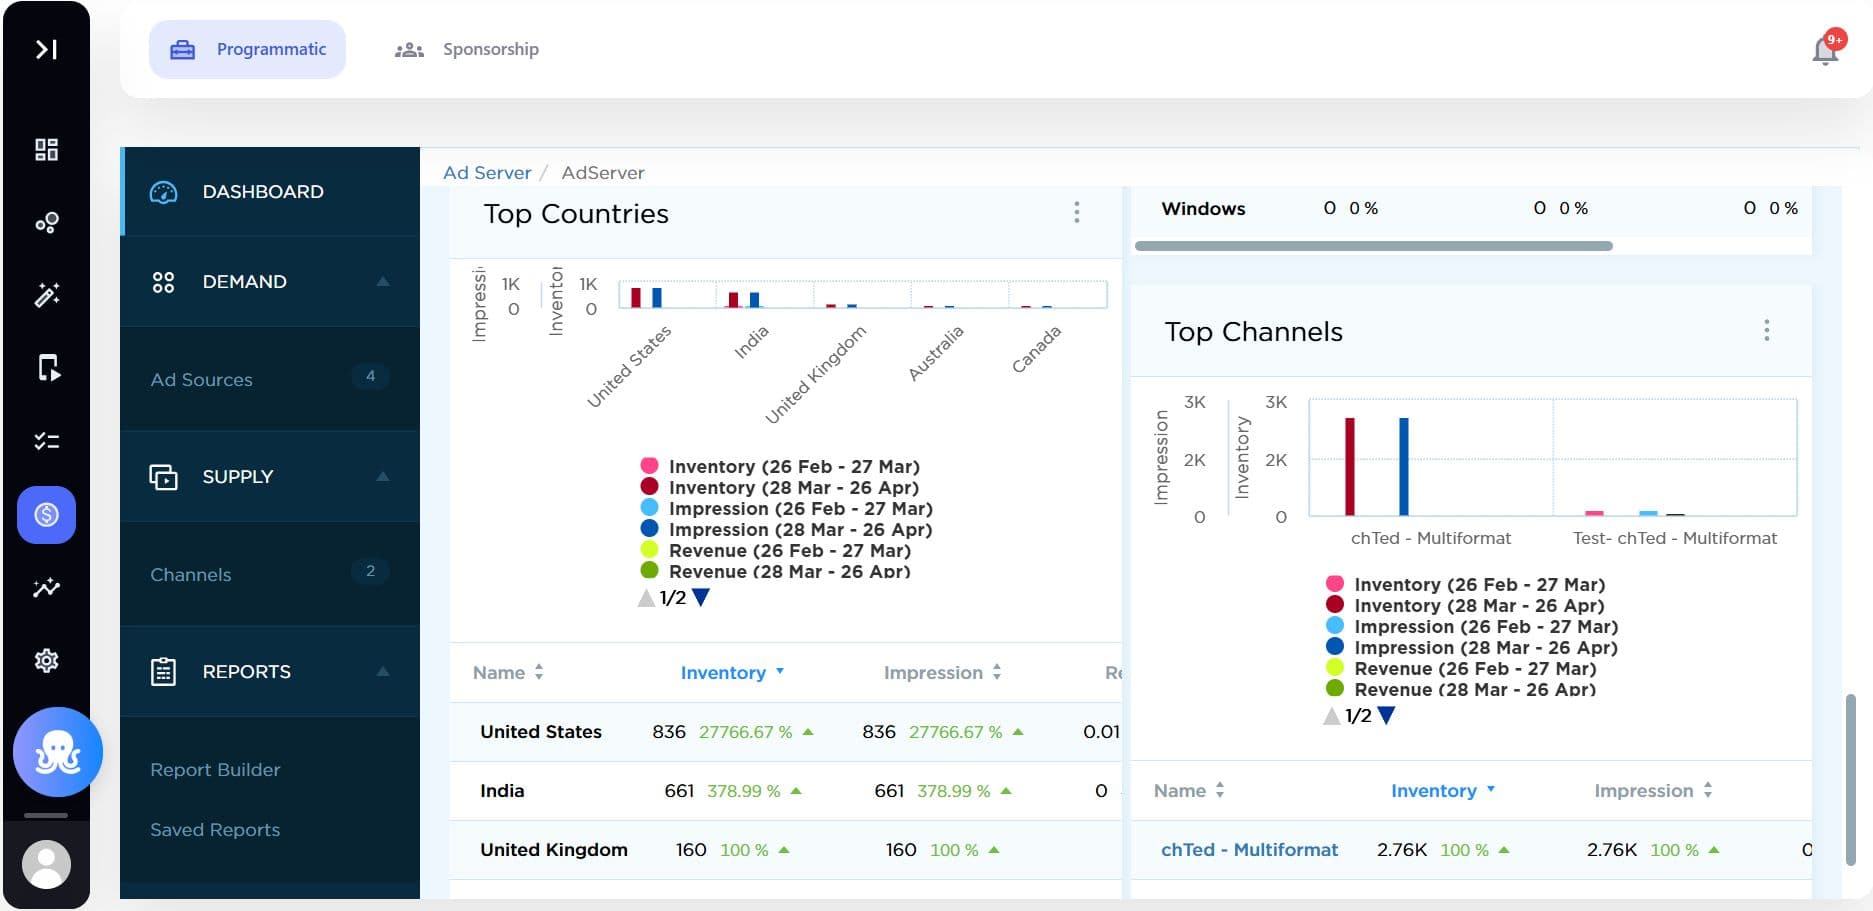
- Top Countries & Top Channels
Step 6: View and analyze reports
- Generate the report to view device-level breakdowns
- Identify trends such as:
- Top-performing devices
- Platform-specific engagement patterns
- Revenue contribution by device
How it works (System behavior)
- Device information is automatically captured via SDKs and web integrations
- Data is aggregated and available in reporting dashboards in near real-time
- Device-level insights can be combined with:
- Content performance
- Monetization data
- Audience segmentation
Best practices
- Regularly monitor device trends to optimize UI/UX
- Prioritize high-traffic platforms for feature rollouts
- Use device insights to refine ad placements and formats
- Combine with AI-driven analytics for deeper audience understanding
Specs & Limitations
- Available device dimensions may vary by integration (SDK vs Web)
- Some granular data (e.g., exact device model) may be restricted
- Data availability depends on user consent and privacy settings
- Reporting latency may vary based on data volume and configuration
