How can brands integrate Google BigQuery with Brand Control Center to push analytics data?
Integrating Google BigQuery with the Brand Control Center enables brands to directly push and analyze their zero-party and engagement data in a scalable data warehouse. This matters because:
- Centralized analytics: Combine Genuin data with other business datasets for unified reporting
- Real-time decision making: Access structured data for faster insights and campaign optimization
- Cost-effective scalability: BigQuery supports large-scale analytics without infrastructure overhead
- Advanced use cases: Power BI tools, dashboards, attribution models, and audience segmentation
- Data ownership & control: Maintain full ownership of your exported data for governance and compliance
Guide: Step-by-step integration flow
Step 1: Prepare your Google Cloud (BigQuery) setup
Before connecting with Brand Control Center, configure your BigQuery environment:
- Go to your Google Cloud Console
- Create a Service Account
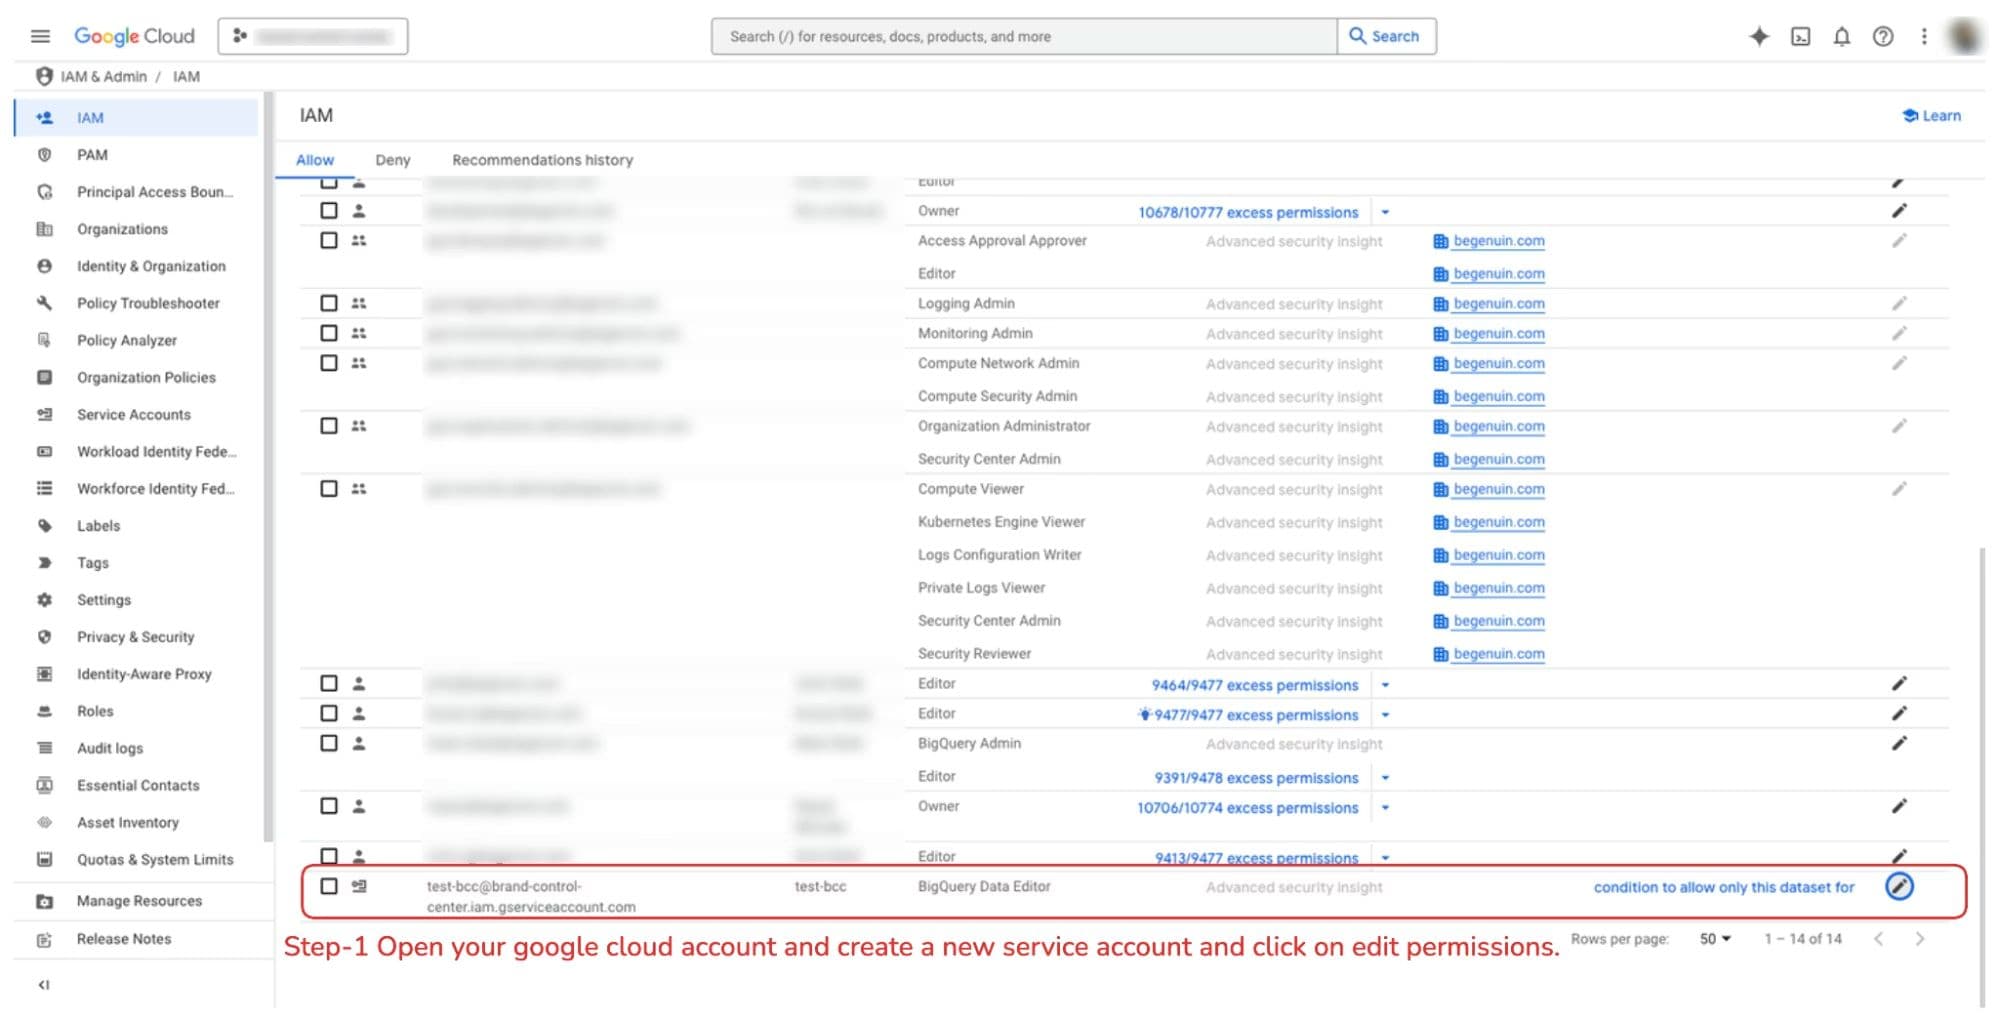
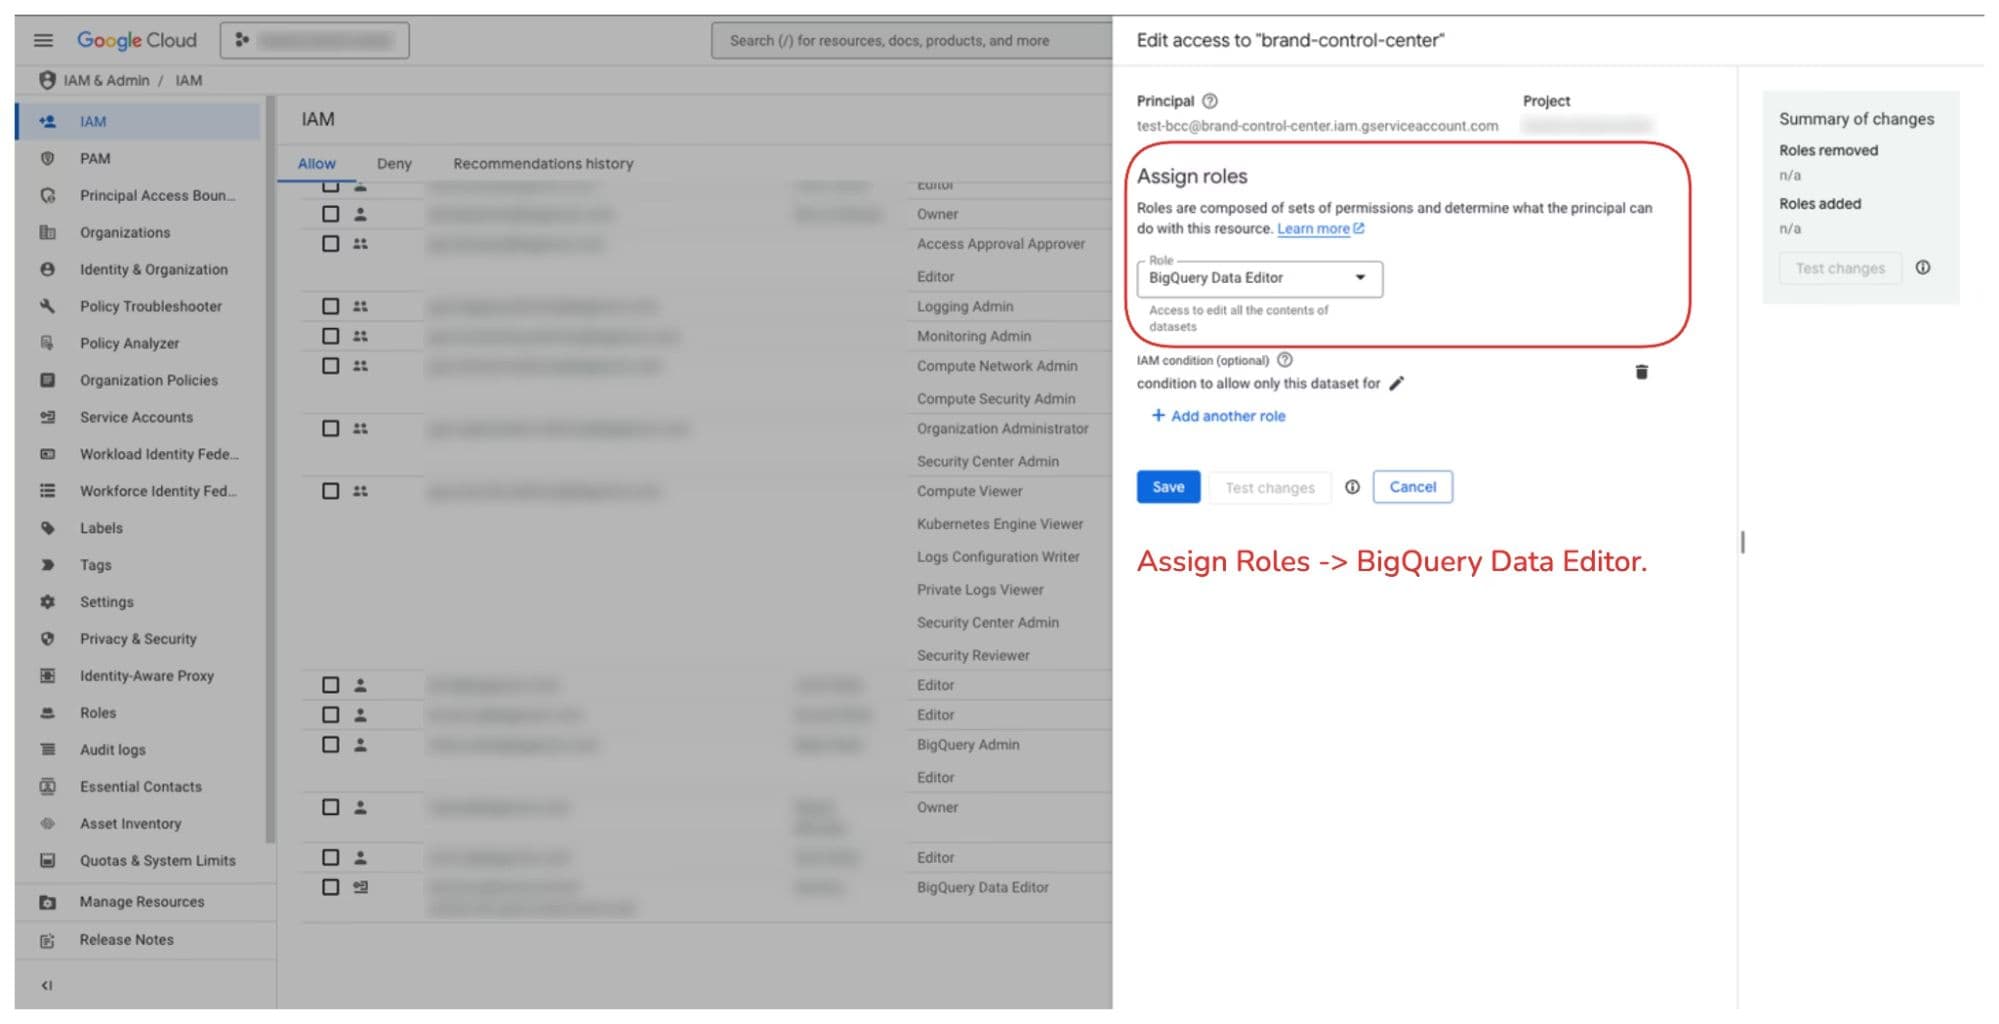
3. Assign the required role:
- Role: BigQuery Data Editor
4. Apply access conditions:
- Service = bigquery.googleapis.com
Name starts with: projects/<project_name>/<dataset_name>
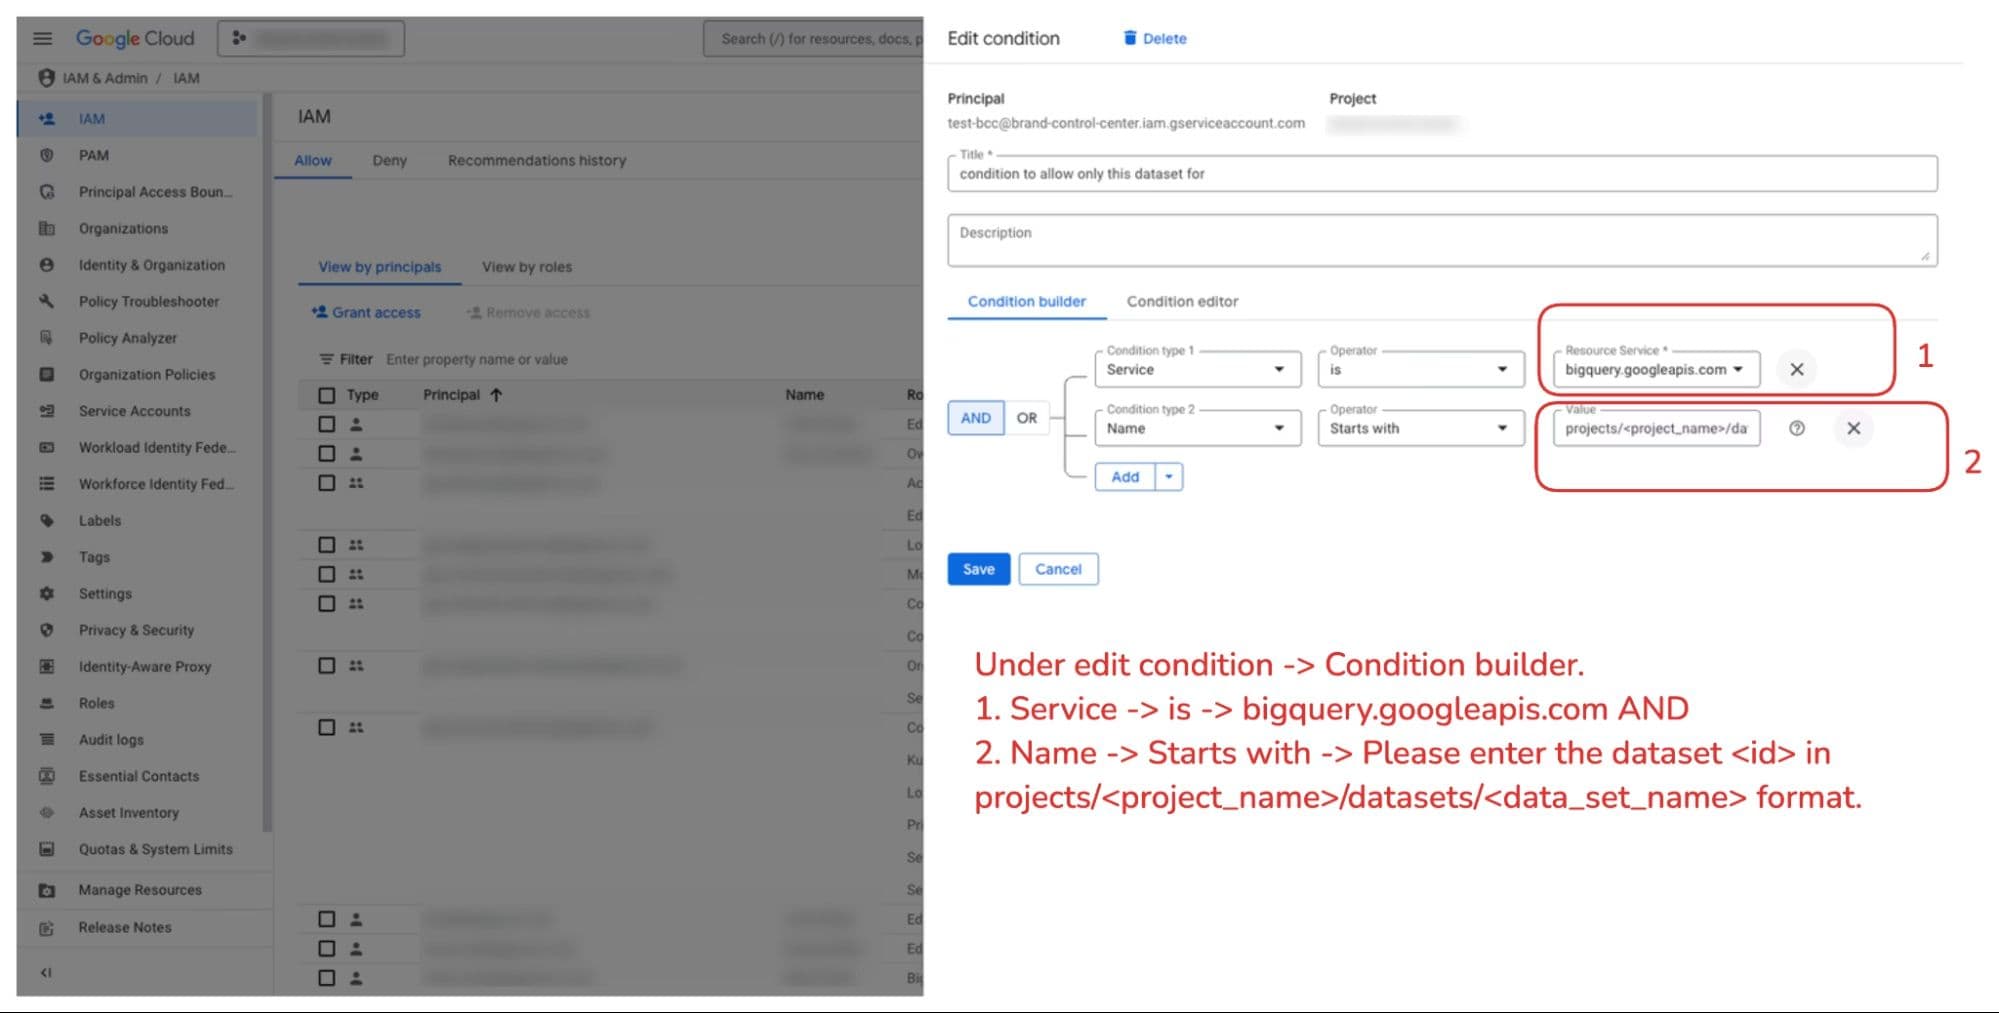
Note: This ensures secure and restricted access only to the required dataset.
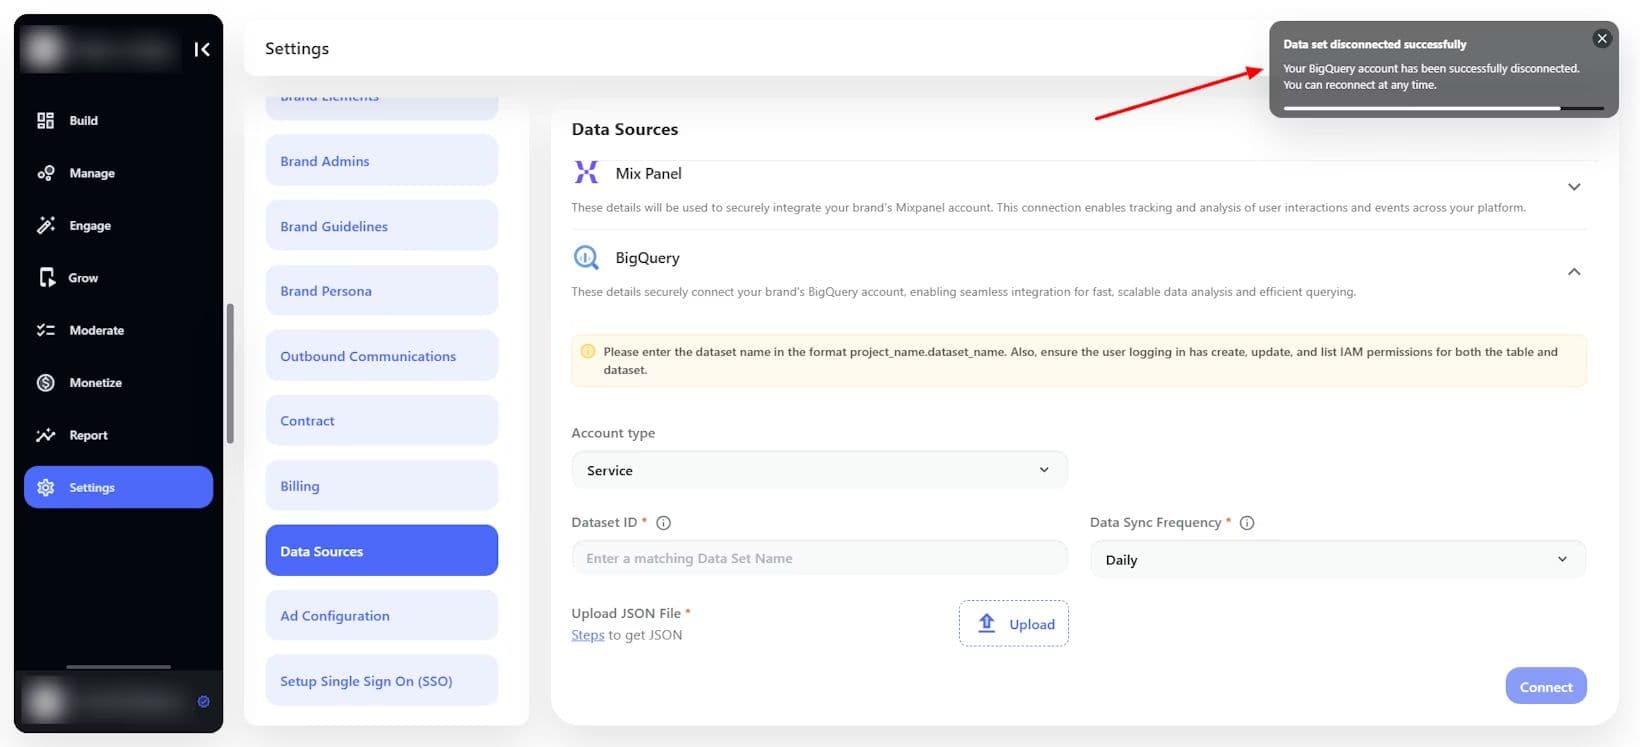
Step 2: Navigate to BigQuery integration in Brand Control Center
- Login to Brand Control Center
- Go to: Settings > Data Sources > BigQuery
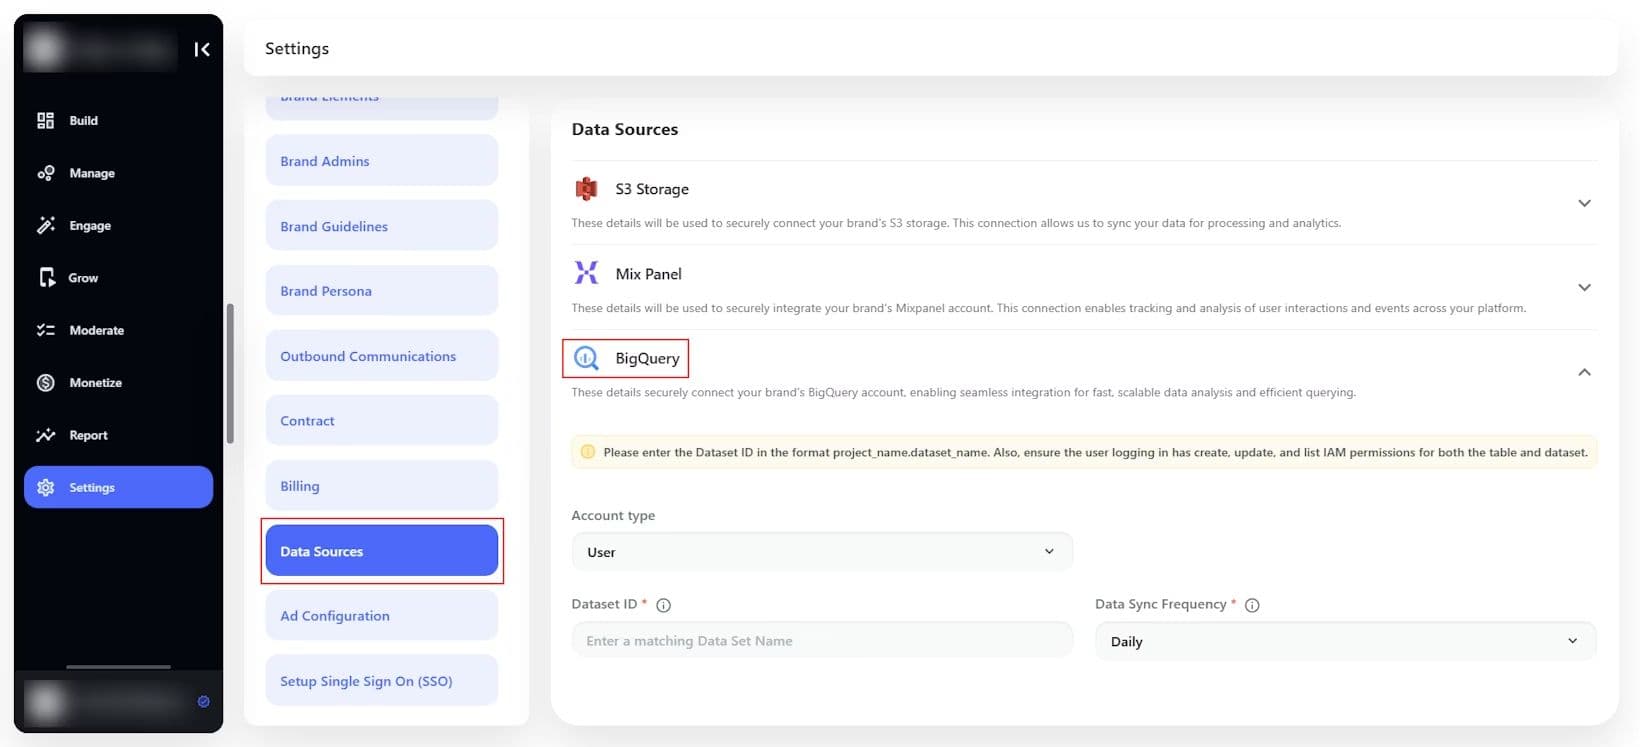
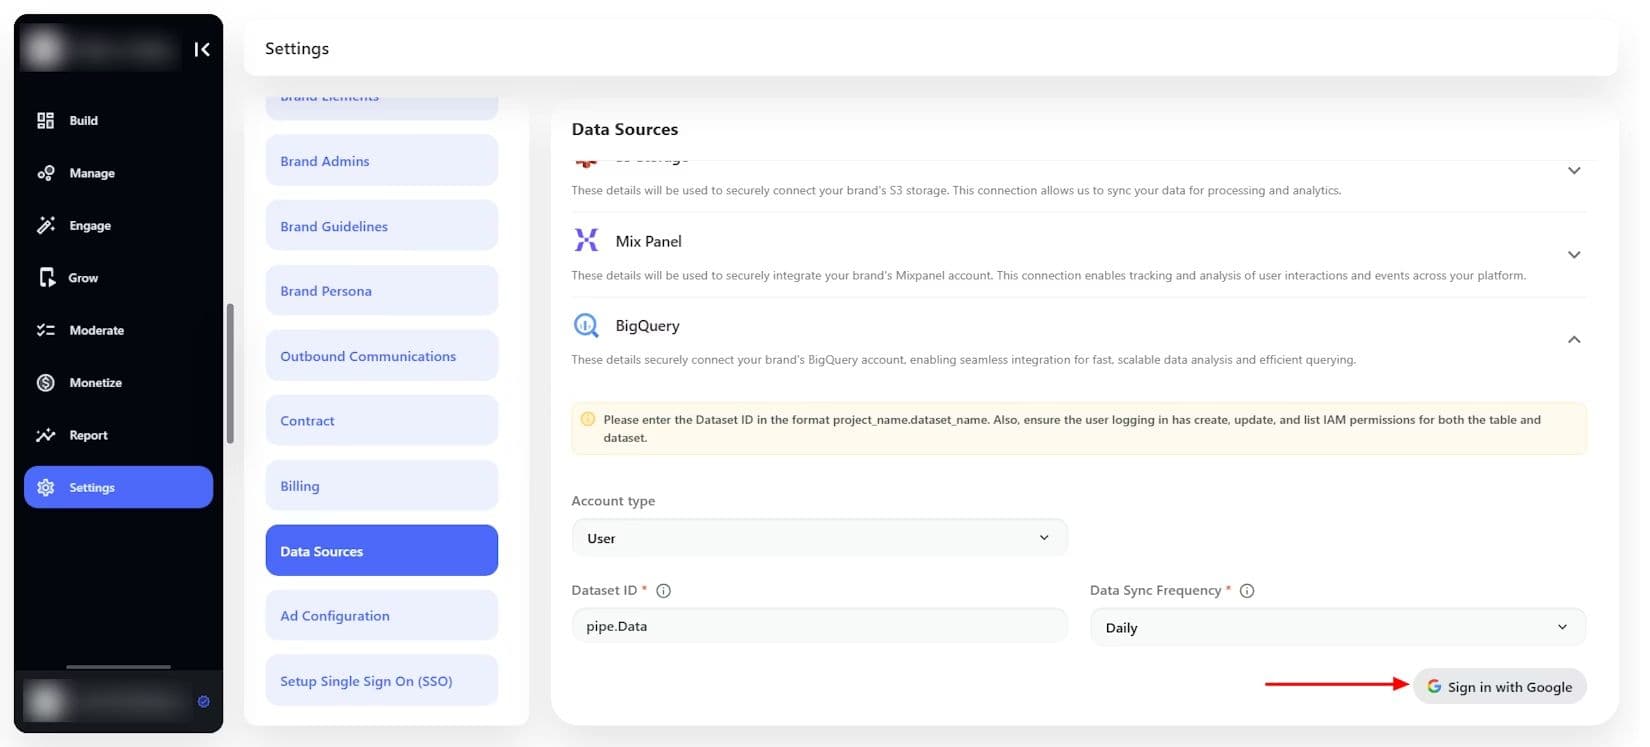
Step 3: Choose account type
You can connect BigQuery using two methods:
Option A: User Account (Simpler setup)
Enter Dataset ID.
Format: project_name.dataset_name
- Select Data Sync Frequency:
- Daily
- Weekly
- Monthly
- Click Sign in with Google and authenticate
Option B: Service Account (Recommended for production)
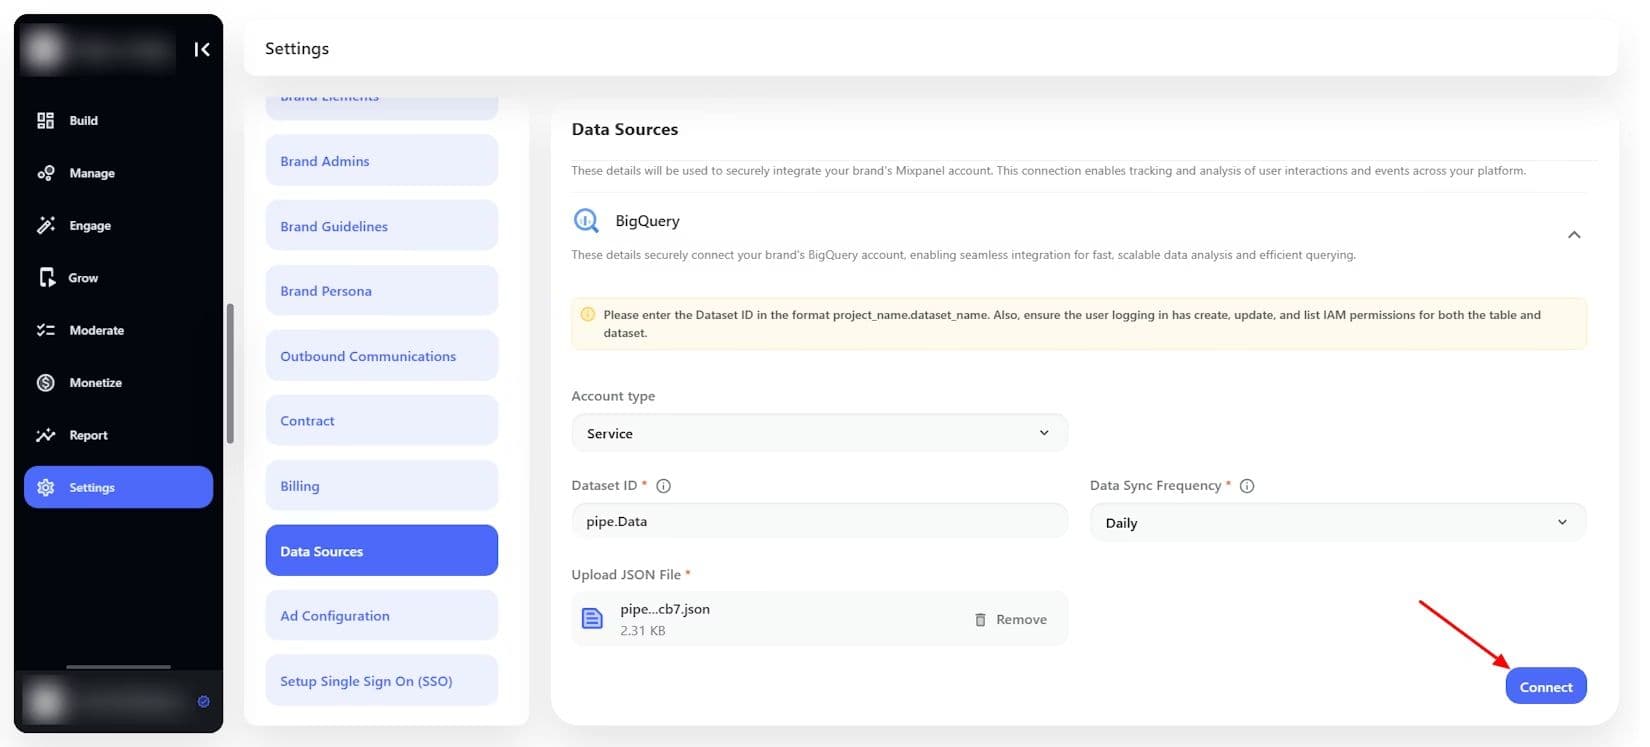
- Upload JSON authentication file (from Google Cloud Service Account)
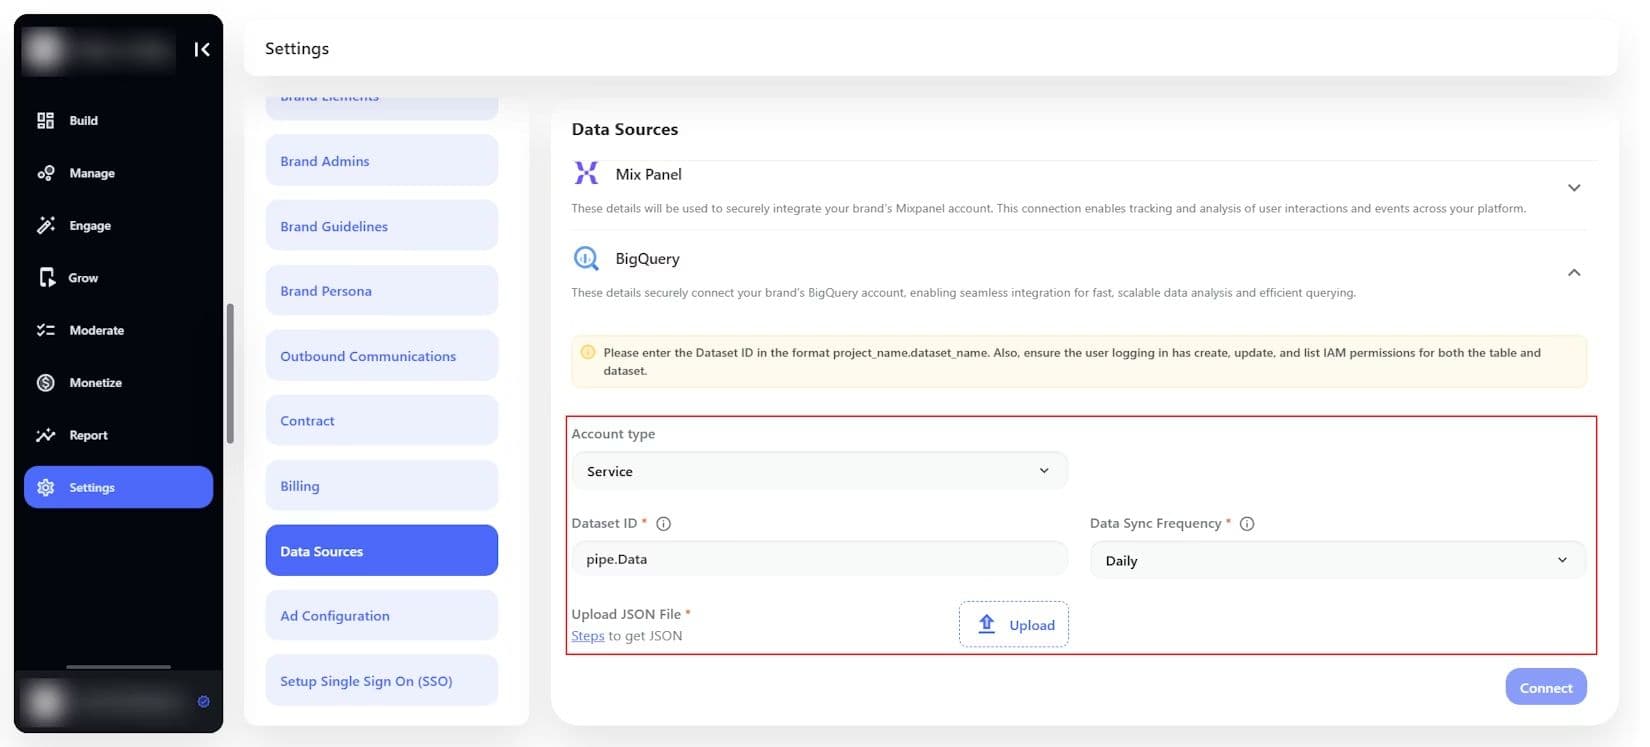
- Enter Dataset Name
- Select Data Sync Frequency
- Click Connect
Note: Service accounts are preferred for automation and enterprise-grade security.
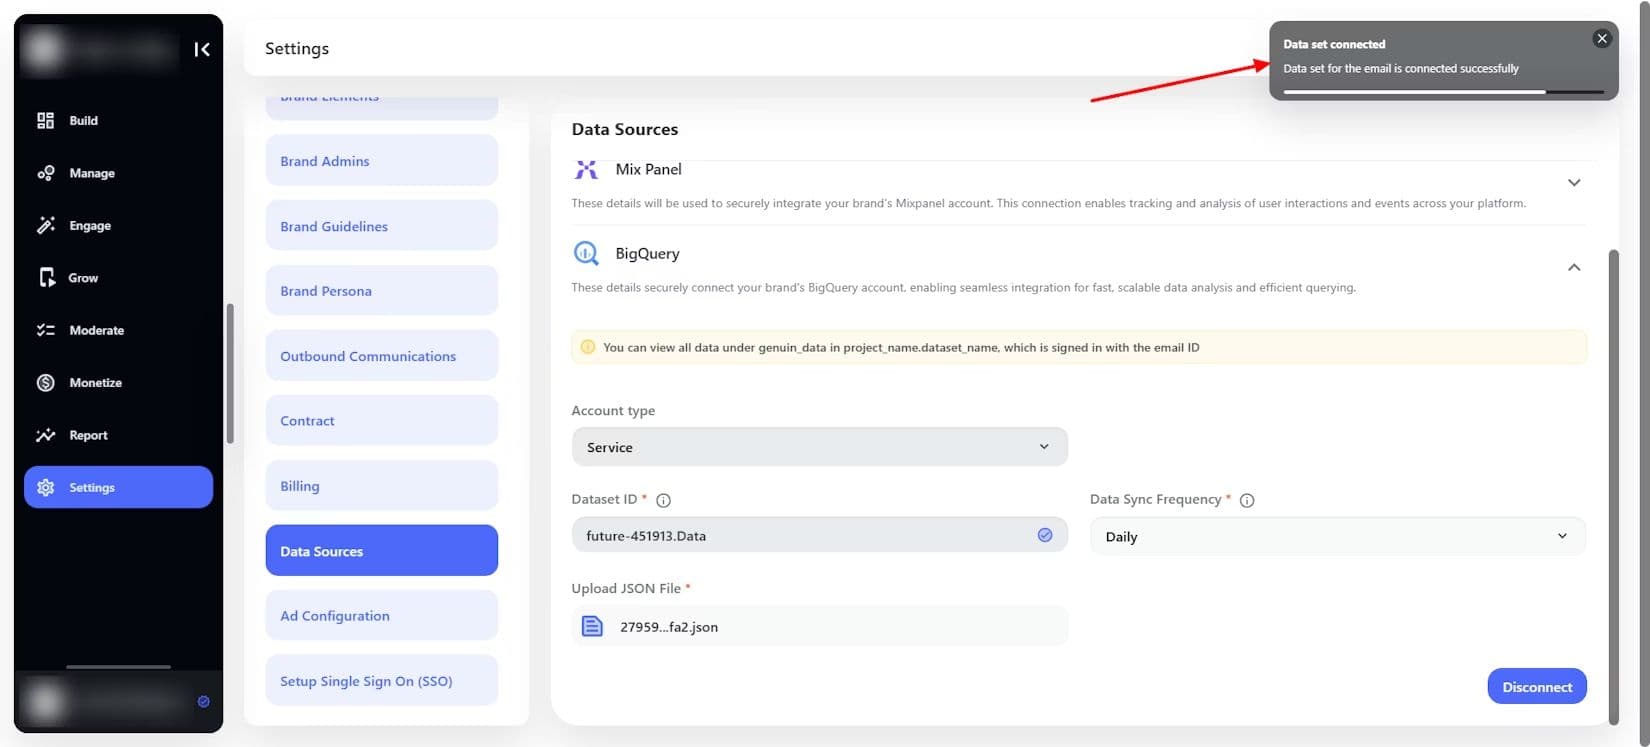
Step 4: Data sync and table creation
Once connected:
- A table named genuin_data is automatically created in your dataset
- Brand Control Center starts pushing analytics data based on selected frequency
- Data includes:
- User engagement
- Content interactions
- Device and behavioral signals
- Community activity
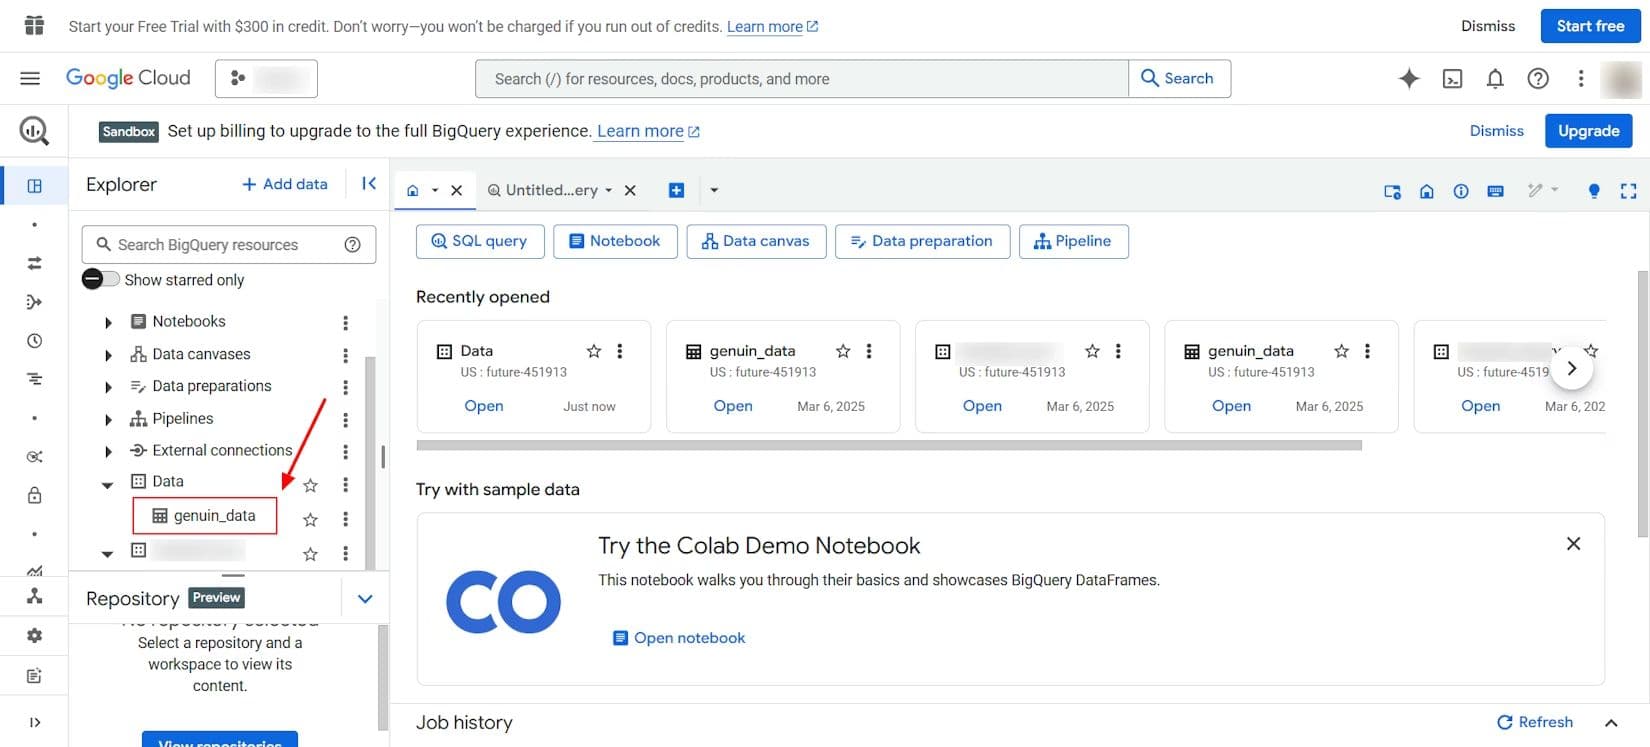
Step 5: Validate and use the data
- Open your BigQuery dataset
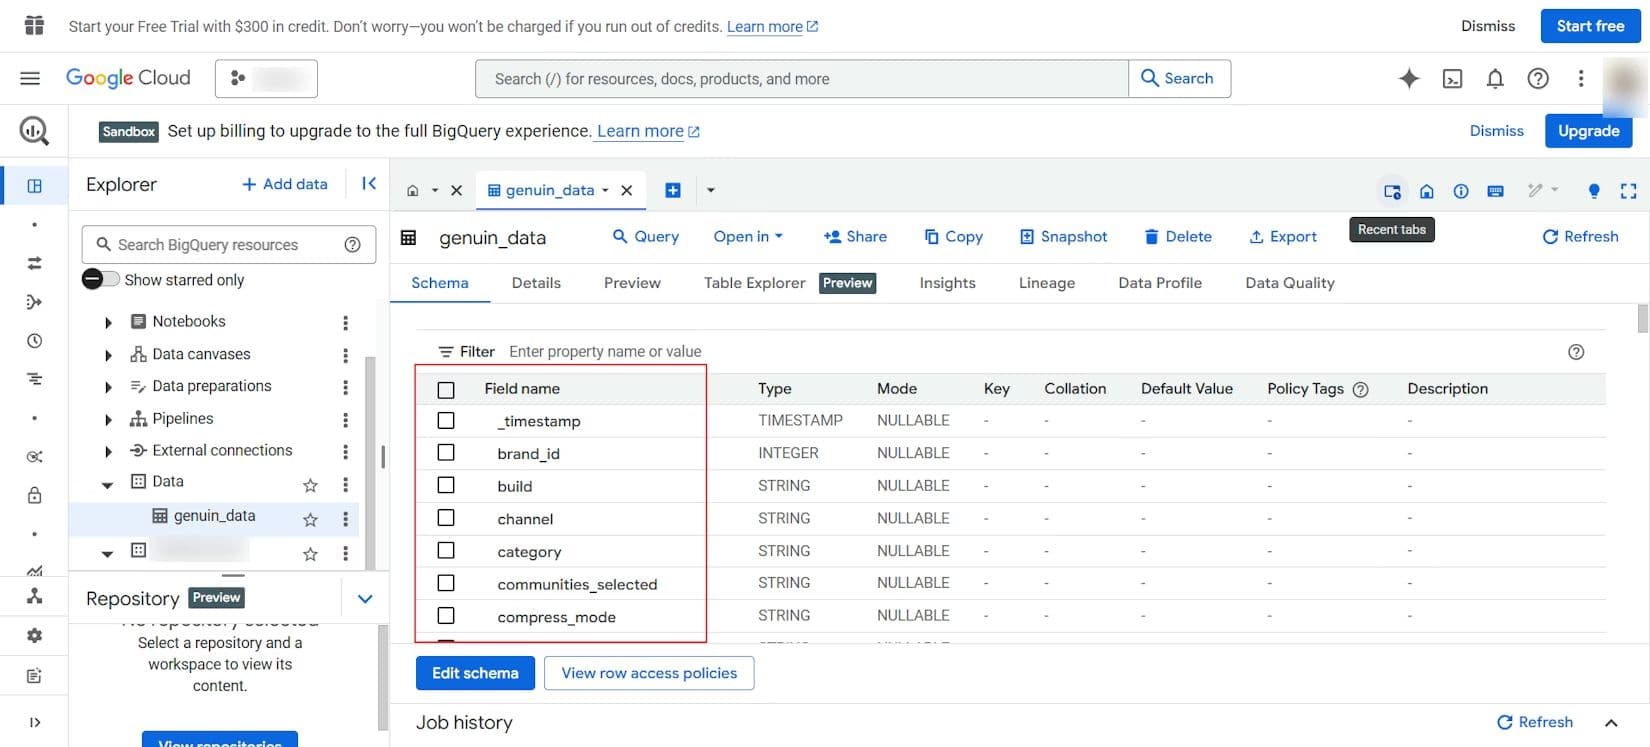
- Verify the genuin_data table
- Use SQL queries or BI tools to:
- Build dashboards
- Track performance
- Analyze user behavior
- Measure monetization impact
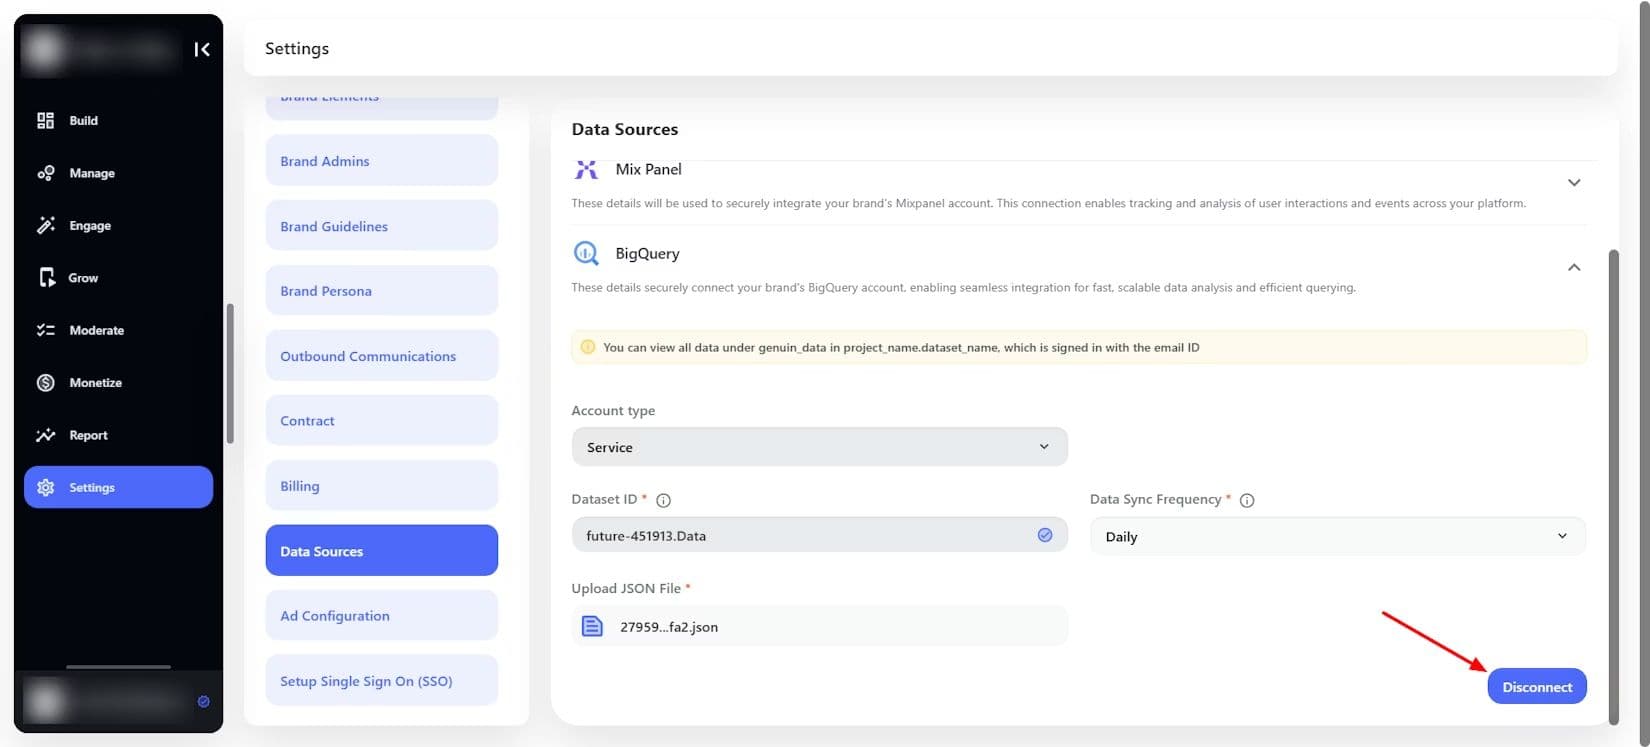
Step 6: Disconnect (if needed)
- Navigate back to Settings > Data Sources > BigQuery
- Click Disconnect
- Confirm the action
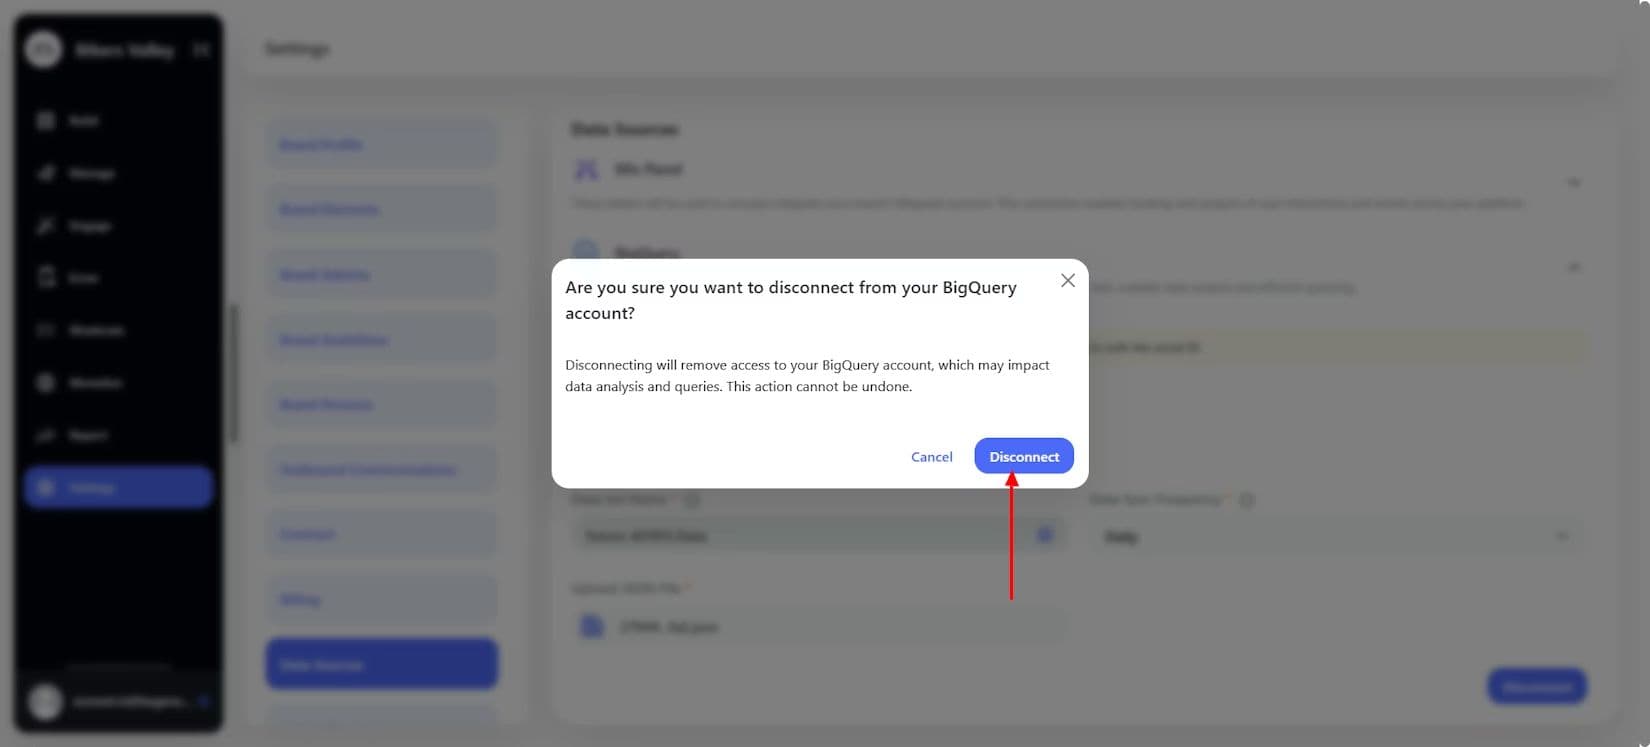
Important:
- Data sync will stop immediately
- Previously synced data will remain in your BigQuery dataset
Specs & Limitations
System Behavior
- Data is pushed automatically based on configured frequency
- A standard table (genuin_data) is created for structured ingestion
- Supports both user-based and service-based authentication
Validation Rules
- Dataset ID must follow correct format (project.dataset)
- JSON file is mandatory for Service Account integration
- Google account permissions must include BigQuery access
Limitations
- Historical data is not backfilled automatically before connection
- Data sync frequency cannot be real-time (batch-based only)
- Schema changes (if any) are managed by the system
Example Scenario (Use Case)
A media brand runs multiple communities via BCC and wants to measure content performance and revenue attribution alongside their website analytics.
- They integrate BigQuery using a Service Account
- Data from Genuin flows into the genuin_data table daily
- Their data team combines this with CRM and ad revenue data
- Result:
- Unified dashboards
- Better audience segmentation
- Improved monetization strategies
